Report Documentation Key
Located in the top left of each module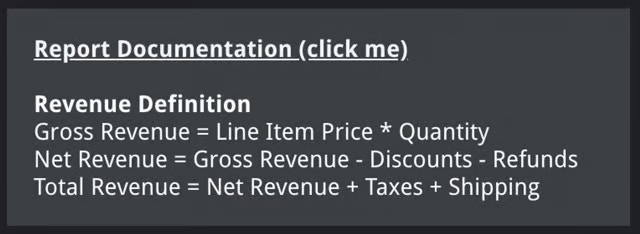
Date Range Filter
Located in the top right of each module and allows you to toggle between any dates since the start of your commerce and marketing platforms ingested data history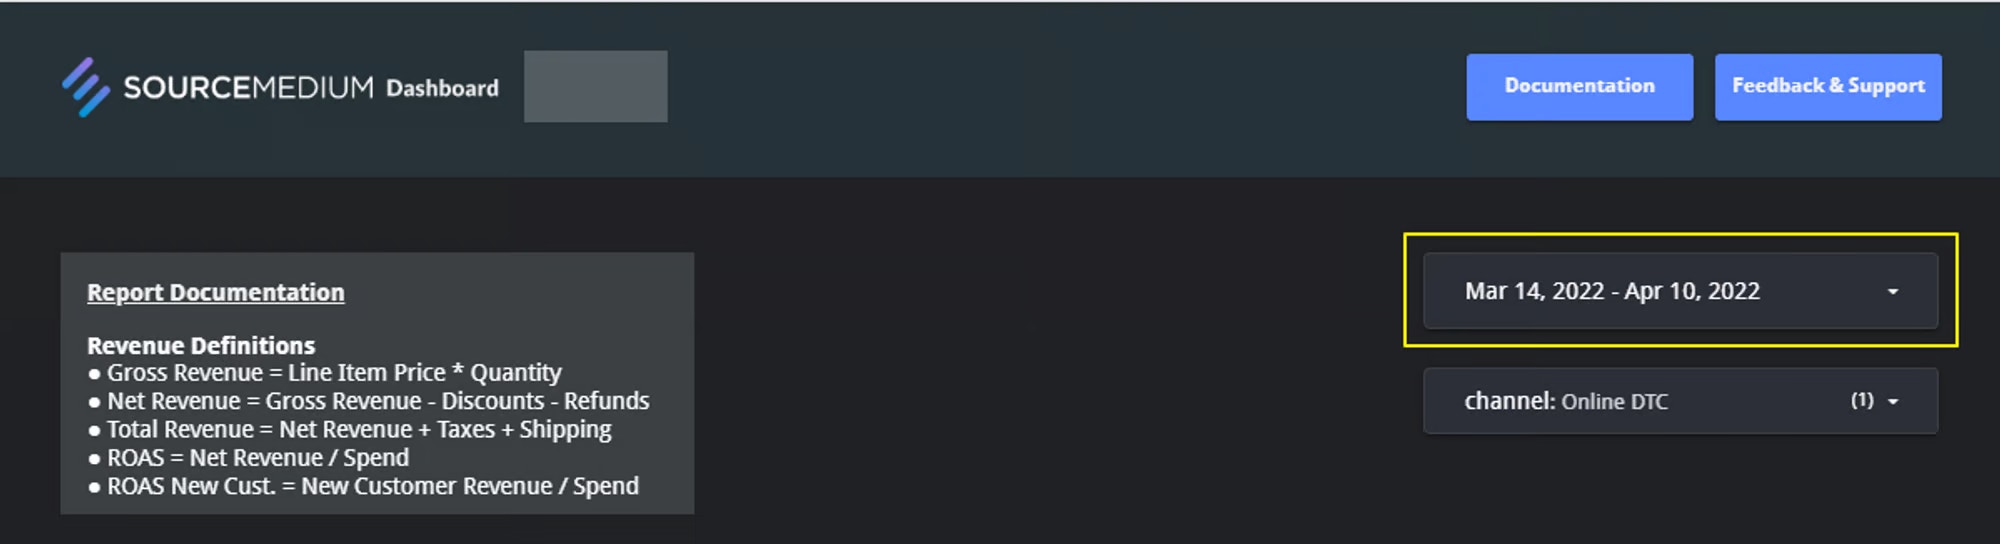
Row Up/Down Icons
The up and down arrows that can be found on many tables and charts help to change the grouping time frame of reference (day ↔ week ↔ month ↔ year) or hierarchy of data (Source/Medium ↔ Campaign ↔ Landing Page)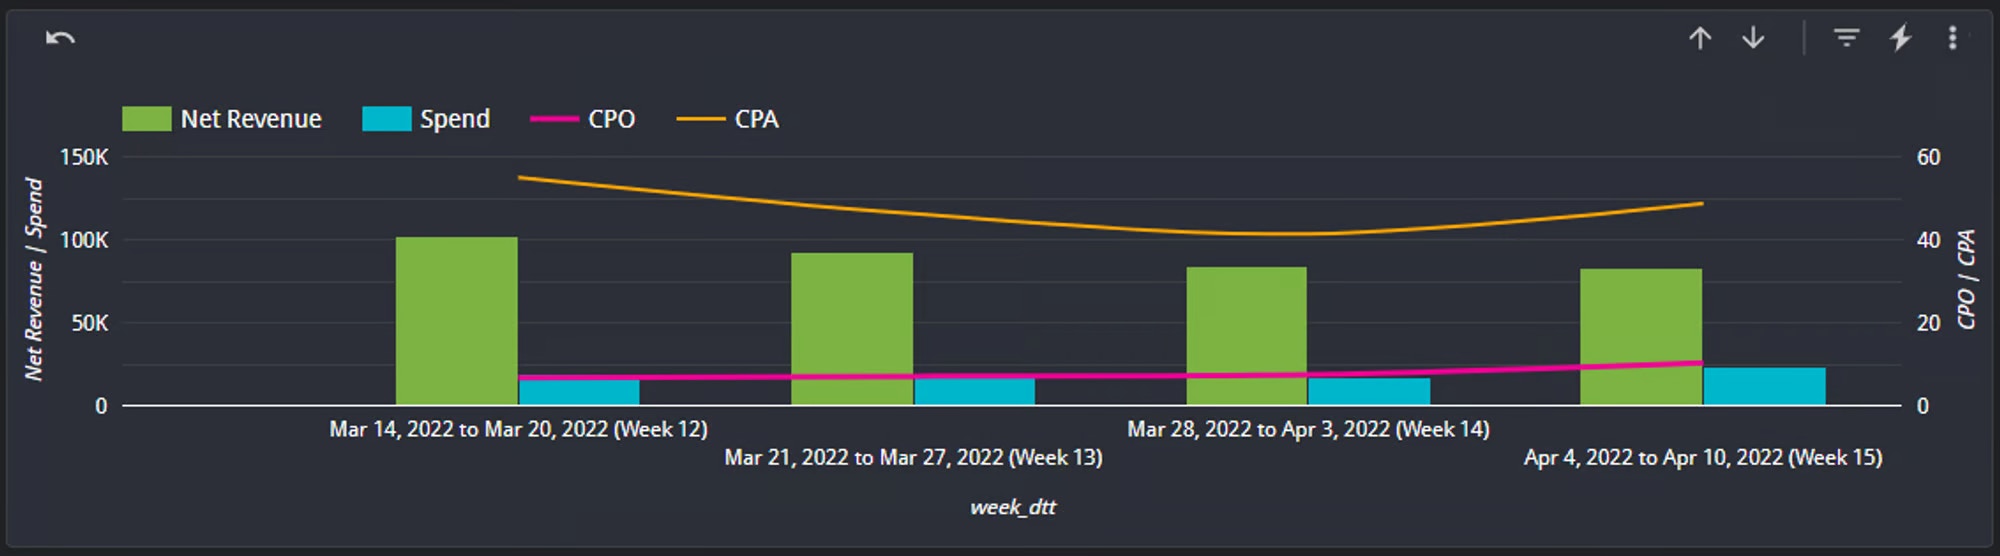
Video walkthrough of using the the Row Up/Down icons for changing date granularity
Video walkthrough of using the the Row Up/Down icons for changing date granularity
Channel Filter
Located in the top right of each module and allows you to toggle between your various commerce and marketing channels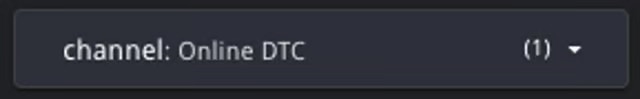
Brand ID Selector
Located in the top right of each module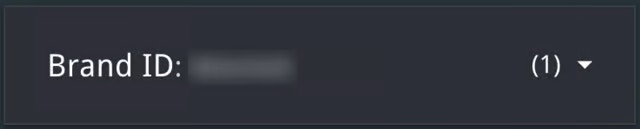
Optional metrics
Available on selected charts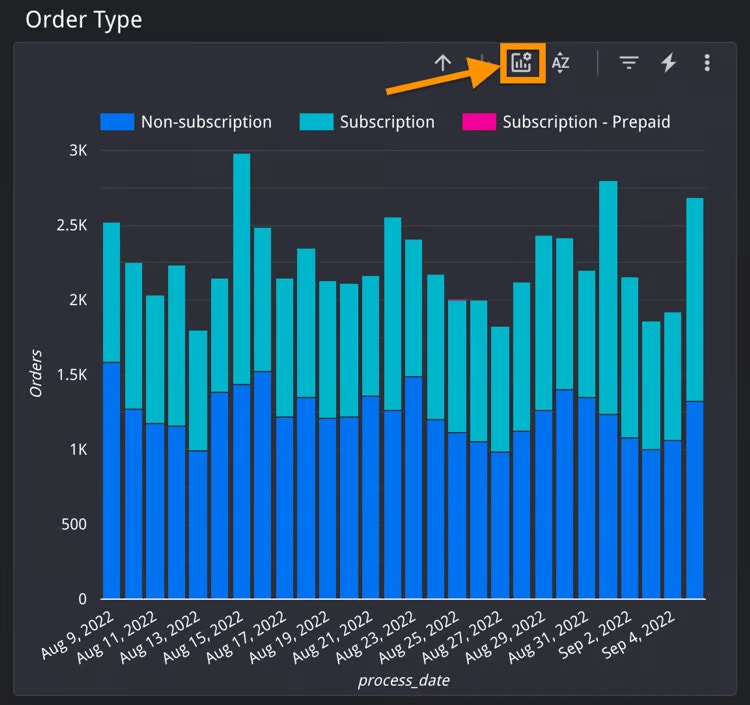
Video walthrough of using optional metrics
Video walthrough of using optional metrics
Resetting filters
Located in the toggle menu bar at the top of each module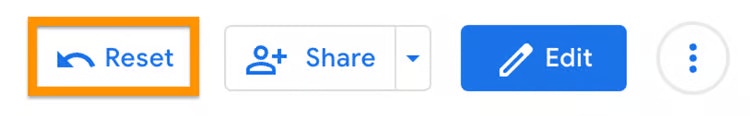
Video walkthrough of resetting module features
Video walkthrough of resetting module features
Saving filter settings
To return to a frequently used analysis you can save all filter settings on any module by bookmarking the page in your browser. Filter selections are maintained within the URL of Looker Studio reports.Exporting data
The data is yours! Any user can export any of the data shown in SourceMedium.To do so, follow these steps...
To do so, follow these steps...
First, make sure the date range selector for the module is properly set to the range you’d like to export1. Select the three dots in the top-right corner of the chart that you want to export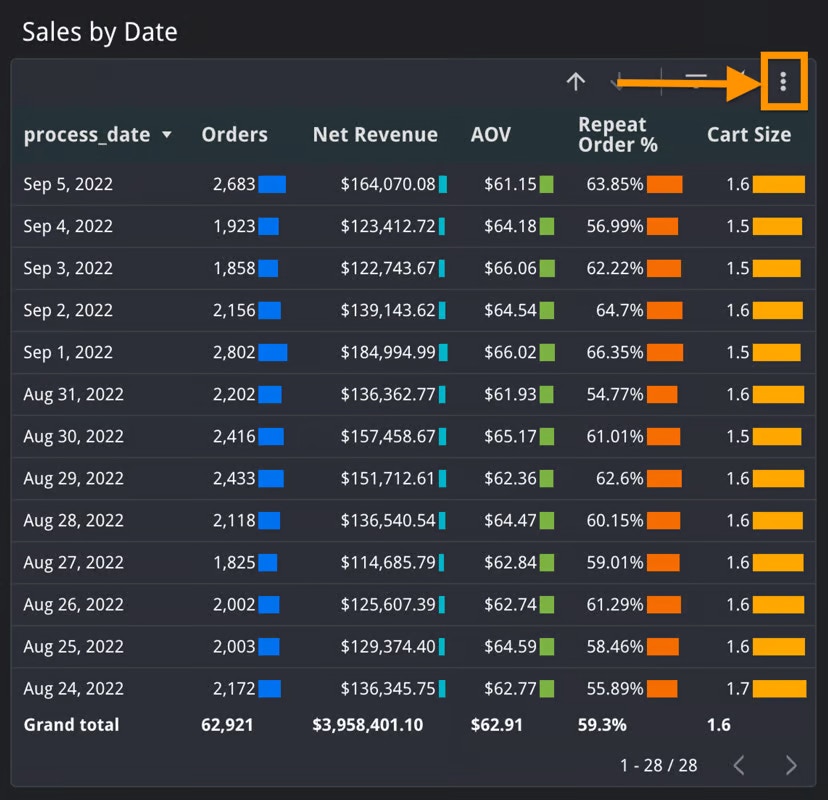
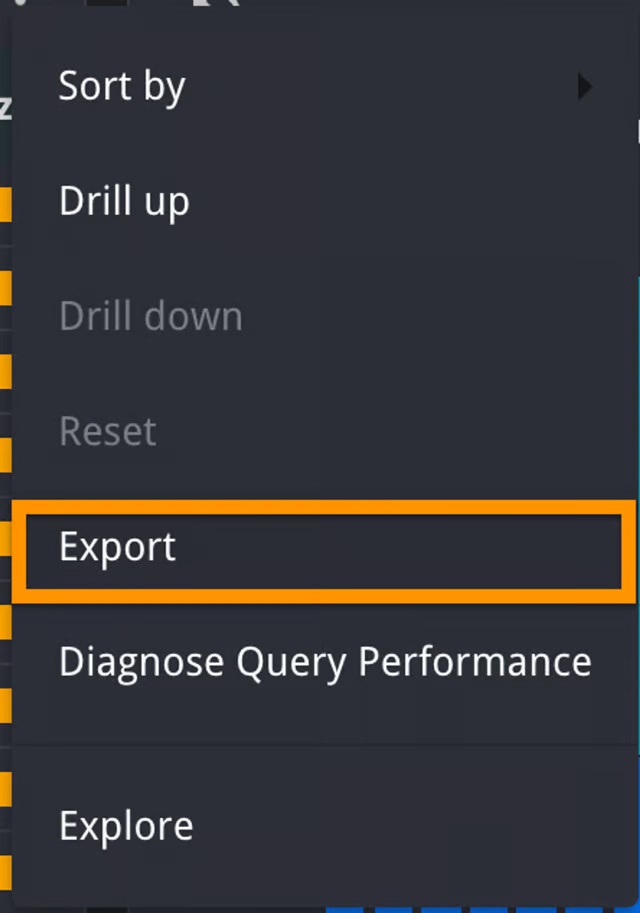
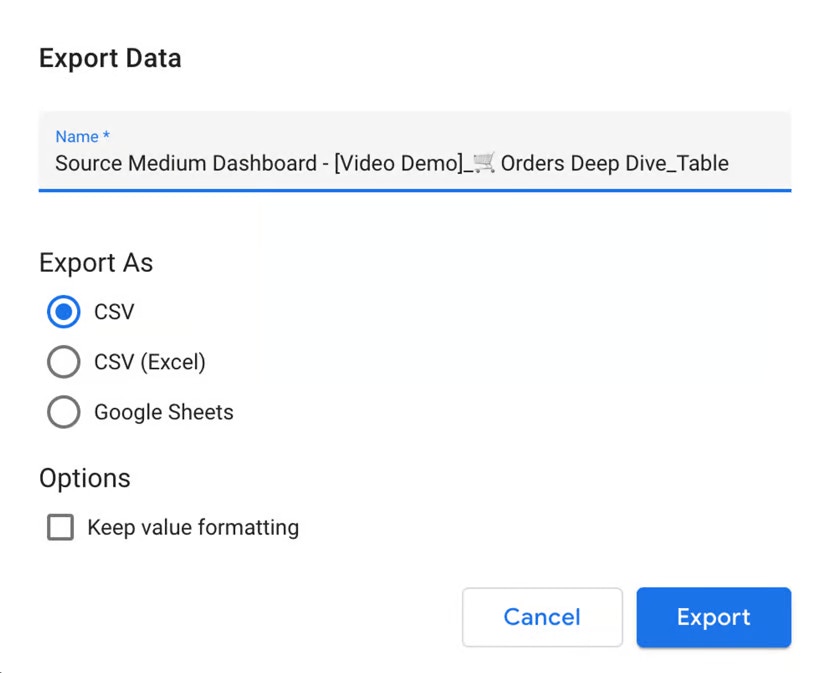
ExportSharing insights
If you would like to share the SourceMedium Dashboard with a coworker, they must first be added to your SourceMedium access group.Follow the video guide below to see how to add someone to view the SourceMedium Dashboard
Follow the video guide below to see how to add someone to view the SourceMedium Dashboard
Watch this video to learn how to share a link to a specified view within the SourceMedium Dashboard
Watch this video to learn how to share a link to a specified view within the SourceMedium Dashboard