What is Source Medium Multi-Touch Attribution (MTA)?
Our model provides a comprehensive view of how various marketing efforts contribute to customer purchases. By unifying data from multiple sources of first party data you already own, we construct detailed purchase journeys that help you understand the impact of different marketing channels, landing pages, and ad creatives. In the sections below, this document will provide everything you need to know to get started with Source Medium MTA.If you have a specific question and you’d like to skip the overview guide, check out our MTA FAQs or use the AI-enabled search bar above to
quickly find what you’re looking for.
If you’re already familiar with Source Medium MTA data and you’d like to explore how to use our built-in reporting, skip ahead to Section 3.
For a verbose technical explanation, skip ahead to our MTA Advanced Documentation.
1
What composes multi-touch attribution data and how is it described?
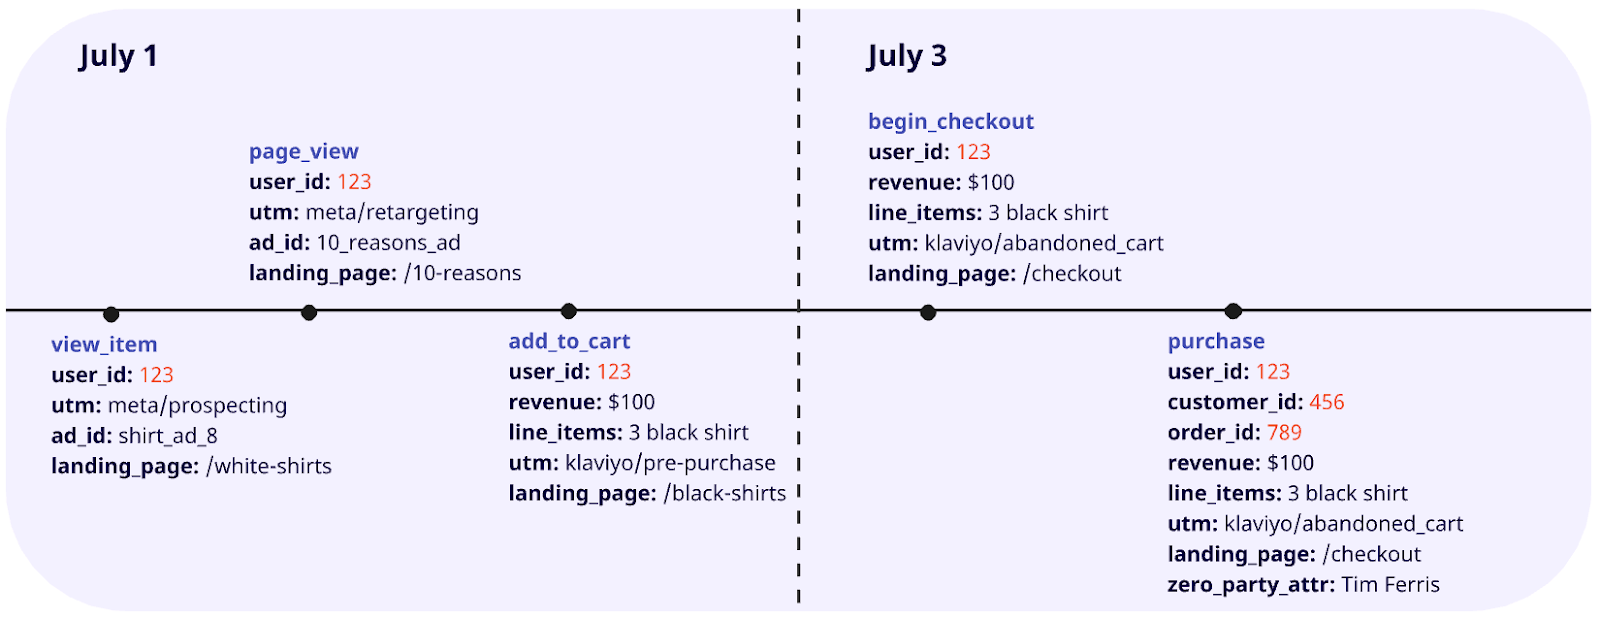
Marketing interactions happen with customers in the form of touch points—many touch points make up a purchase journey, and many purchase journeys make up a multi-touch attribution data set. Click the tabs below to read more about each of these concepts.
- Touch Points
- Purchase Journey
- Multi-Touch Attribution Dataset
- A touch point is an event, occurring before a purchase, where an interaction with a customer is made and touch point data is captured
- Touch point data must contain at least one of the following to be considered valid: a landing page, an ad creative, or a marketing channel (mapped UTM data)
- Add to carts, purchases, and confirmations are touch points, but they are not the primary focus of the Source Medium MTA model as they do not provide attribution insights
- Touch points are only valid within the lookback window, which is 120 days before the customer makes their purchase
2
Where Does Multi-Touch Attribution Data Come From, and How is it Modeled?
Source Medium MTA takes multiple data sources reporting many customer journeys, unifies them into a single schema and assesses their quality, then combines the best of those purchase journeys with Marketing Data, Orders Data, Customer Data, and User Inputs to create a Unified Purchase Journey Dataset. View this process in the figure below.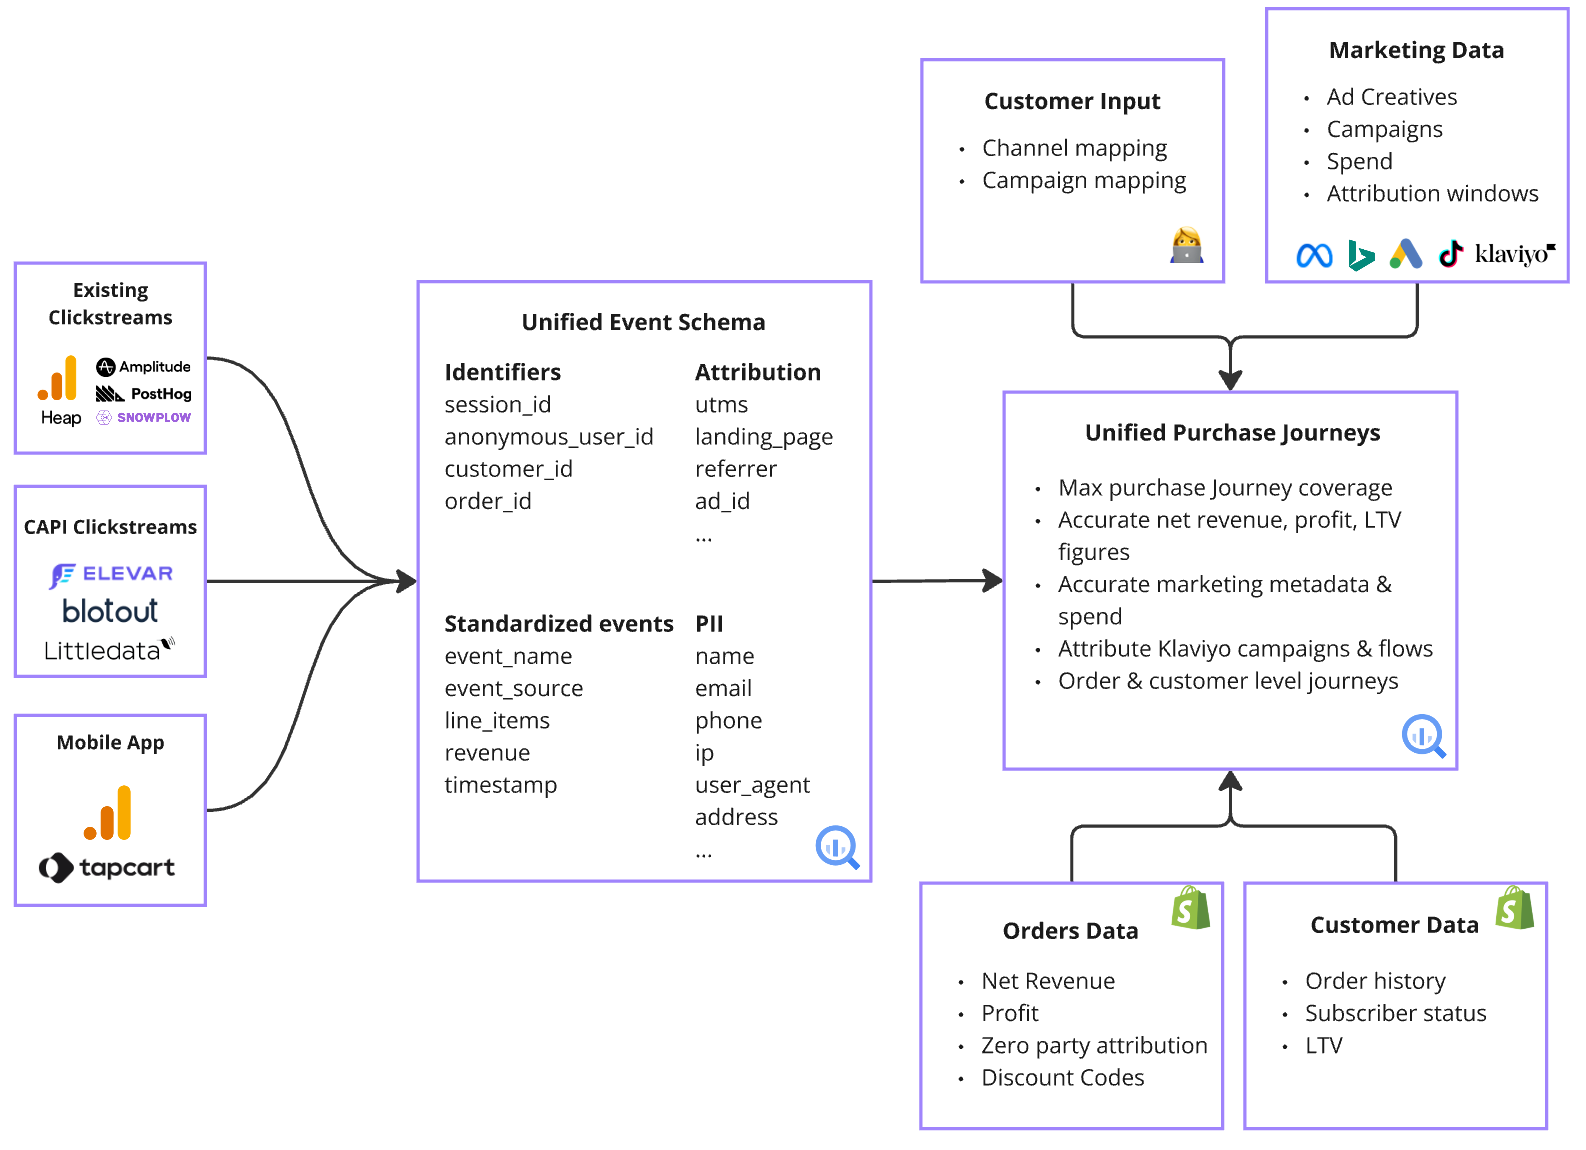
- MTA Architecture
- Attribution Modeling
- Source Medium integrates first-party purchase funnel data from a variety of data sources, you’ll see them listed and categorized on the left-hand side of the chart above
- The purchase journeys from all data sources are assessed for quality by number of valid touch points and the best are selected, this creates the Unified Event Schema you’ll see in the middle of the chart
- The Unified event Schema is combined with Marketing Data, Orders Data, Customer Data, and User Inputs using the appropriate identifier matching for each to create a set of Unified Purchase Journeys which you’ll see on the right-hand side of the chart
Architecture and modeling is explained in greater detail in our MTA Advanced Documentation
3
How can I Analyze Source Medium Multi-Touch Data?
Source Medium MTA data architecture and modeling powers a robust suite of detailed reports to help you analyze and optimize your marketing efforts. If desired, you can customize these MTA reports for your use case—and you can even build custom BI solutions or train machine learning models directly on top of the Unified Purchase Journey MTA data from your managed data warehouse.
If you’re already familiar with Source Medium MTA, or you’d like to just get started with analysis, feel free to skip the Reporting Definitions below and move ahead to the MTA Built-in Reports section.
Key MTA Reporting Definitions
Key MTA Reporting Definitions
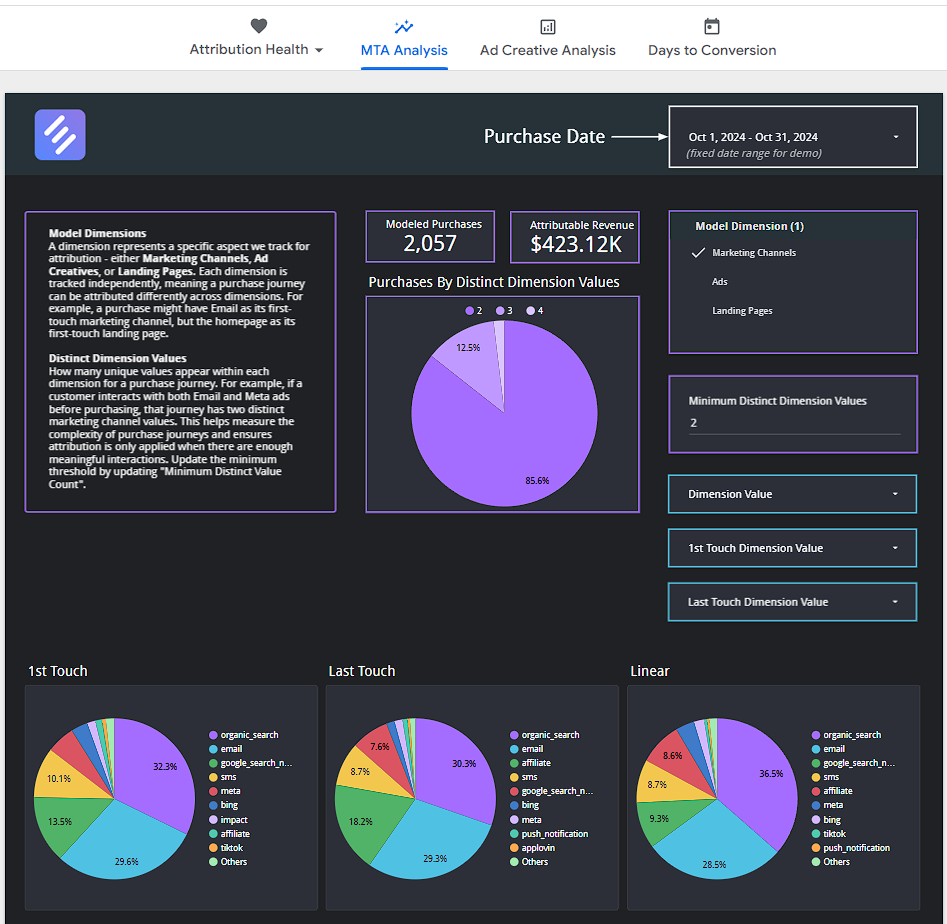
Model Dimension
- In the specific case of Source Medium MTA, model dimension refers to the type of touch point being analyzed
- There are 3 model dimension types used in Source Medium MTA:
- Marketing Channels (mapped UTM)
- Ads
- Landing Pages
- The attributable value is true when there is at least one touch point, for a given model dimension, on a given customer purchase
- The attributable value is false (non-attributable) when there are no touch points for a given model dimension, on a given customer purchase
- Purchases and revenue are both attributable metrics, for each of the three model dimensions
- Distinct dimension values is a count of the number of unique touch points, for a given model dimension
- The same Marketing Channel, Ad ID, or Landing Page will not be counted as a distinct dimension value more than once even if a customer interacts with it multiple times
- Changing the Minimum Distinct Dimension Values setting will filter out customer purchase journeys with fewer than the entered number of touch points, for the selected model dimension
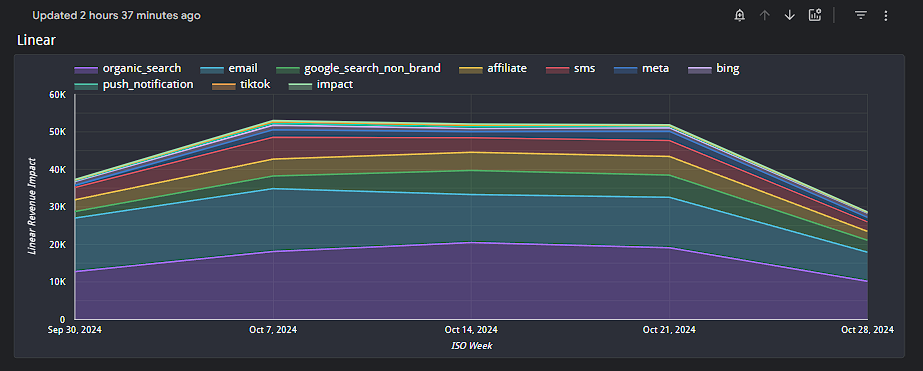
- Source Medium MTA modeling enables three different attribution types:
- First Touch: Assigns all credit to the first valid touch point in the purchase journey
- Last Touch: Assigns all credit to the last valid touch point before the purchase
- Linear: Distributes credit equally among all valid touch points
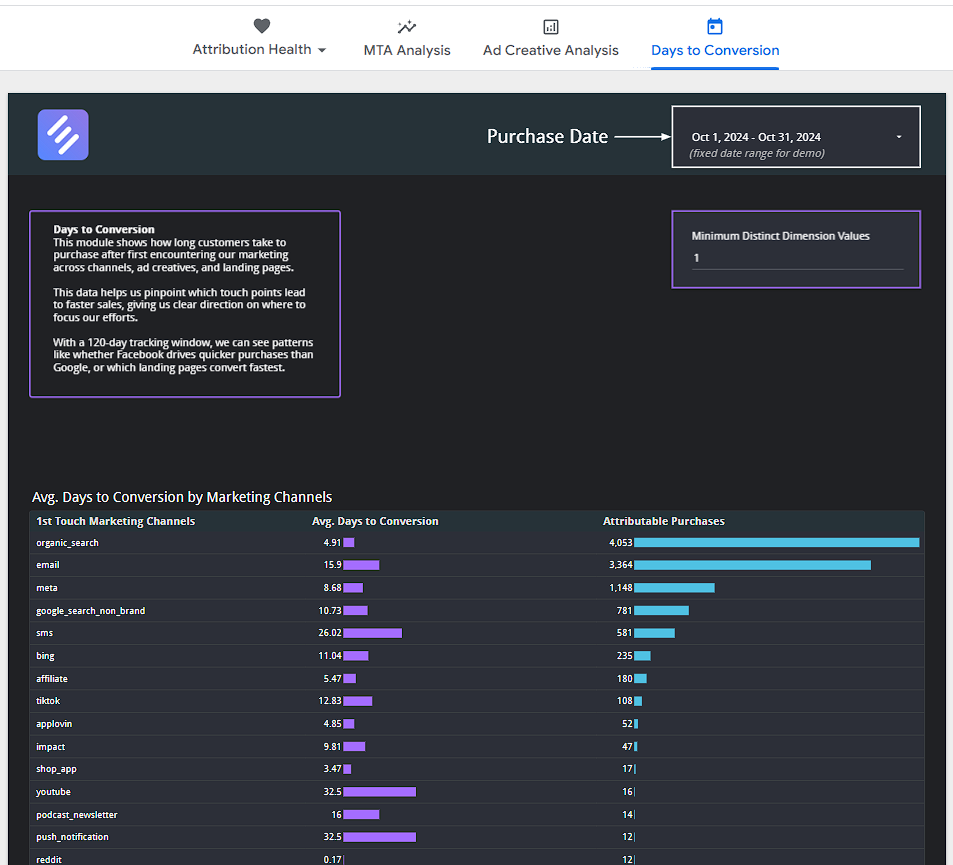
- This is the number of days between the first touch point in a customer purchase journey and the purchase date
- This value is dependent upon the selected model dimension
- The source system is the data platform from which a given customer purchase journey was selected
Source Medium MTA Built-in Reports
Source Medium MTA Built-in Reports
Source Medium MTA built-in reports are part of a standalone dashboard separate from your main Source Medium dash. After MTA is enabled for your account, the dashboard link will be pinned to your shared Slack channel or sent via email/gchat if you do not use Slack. The sections below describe each of the default modules and their functionality.
- Attribution Health
- MTA Analysis
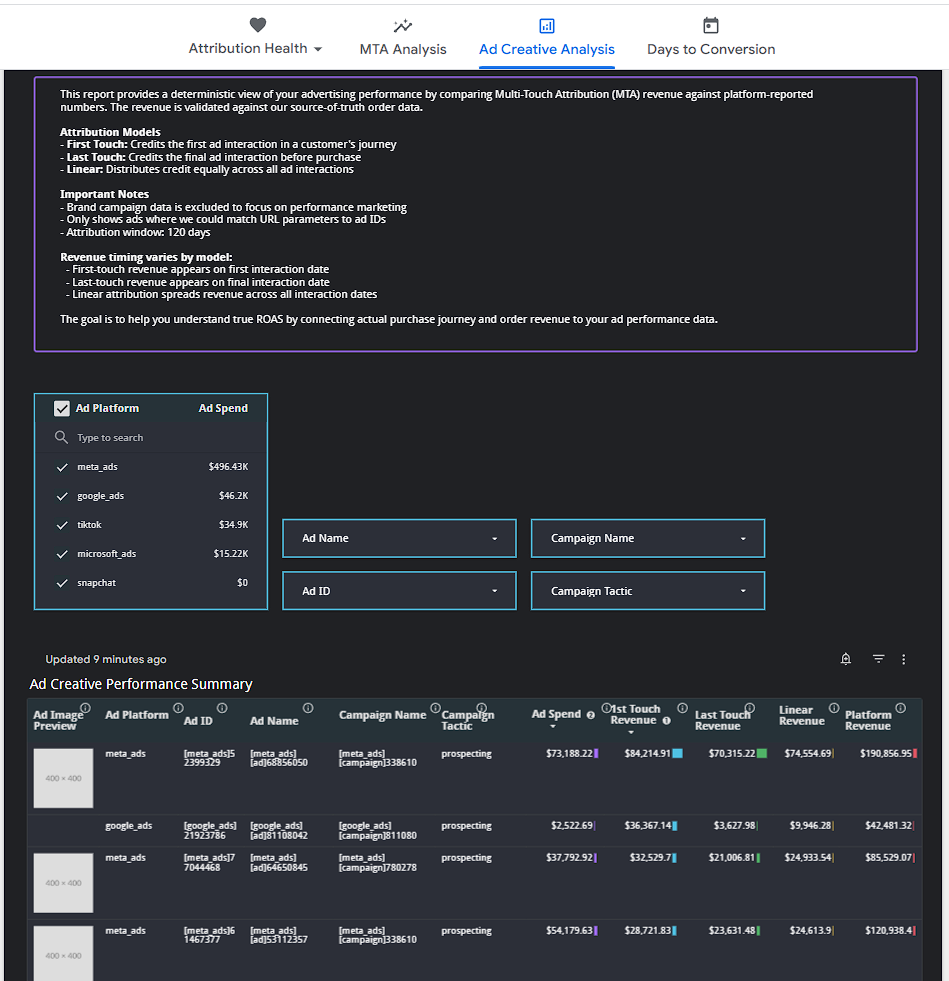
- Ad Creative Analysis
- Days to Conversion
This module provides an overview of how complete your business data is for use with Source Medium MTA. If you find your attribution rates to be low, the MTA Advanced Documentation provides common solutions to this problem in the Attribution Improvement section. You’ll also find a video overview at the top of this module if you’d prefer watching a guide instead of the written format shown here.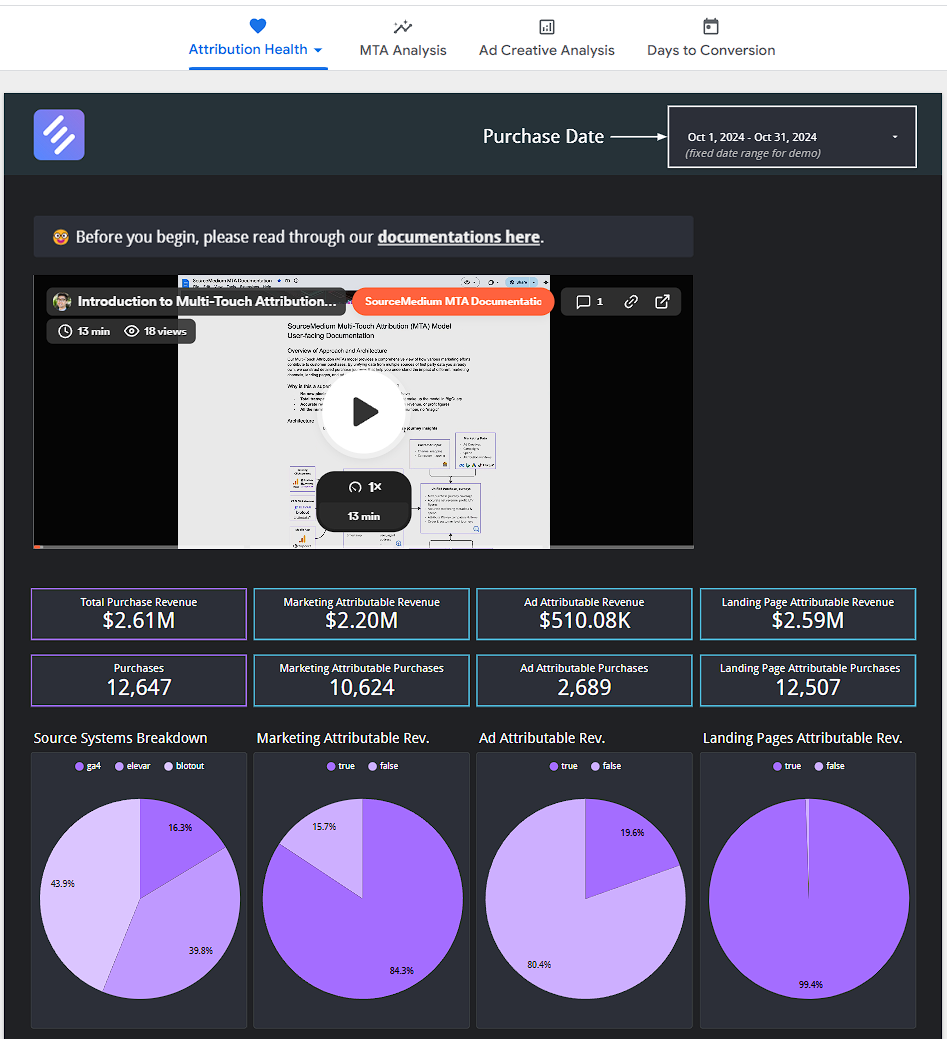
User Interactions:
Select a date range to display data from—complete purchase journeys will be included if their associated purchase date is within the date range, touch points are not excluded by the date setting
This filter is present on all Source Medium MTA modules
Select a date range to display data from—complete purchase journeys will be included if their associated purchase date is within the date range, touch points are not excluded by the date setting
This filter is present on all Source Medium MTA modules
Source Medium MTA Custom Reporting
Source Medium MTA Custom Reporting
To customize the Source Medium MTA dashboard, such as changing visualizations or swapping metrics, you can use the edit mode in Looker Studio as you would on your main dashboard. For more information on how to do this, see our Looker Studio Customization Guide (in progress, link coming).To access the MTA data directly within your managed data warehouse for custom BI solutions or ML modeling, or for more advanced usage and customization information, view the Warehouse Data section of our MTA Advanced Documentation.