1. Overview of SourceMedium
SourceMedium is a data and analytics product for omni-channel, digital-first brands. We help teams create a single view of their operations by centralizing data across e-commerce, marketing, subscription, and operations platforms (see our current list of available integrations). SourceMedium is used by brands at a range of growth stages and data maturity levels.2. A Turnkey Analytics Hub
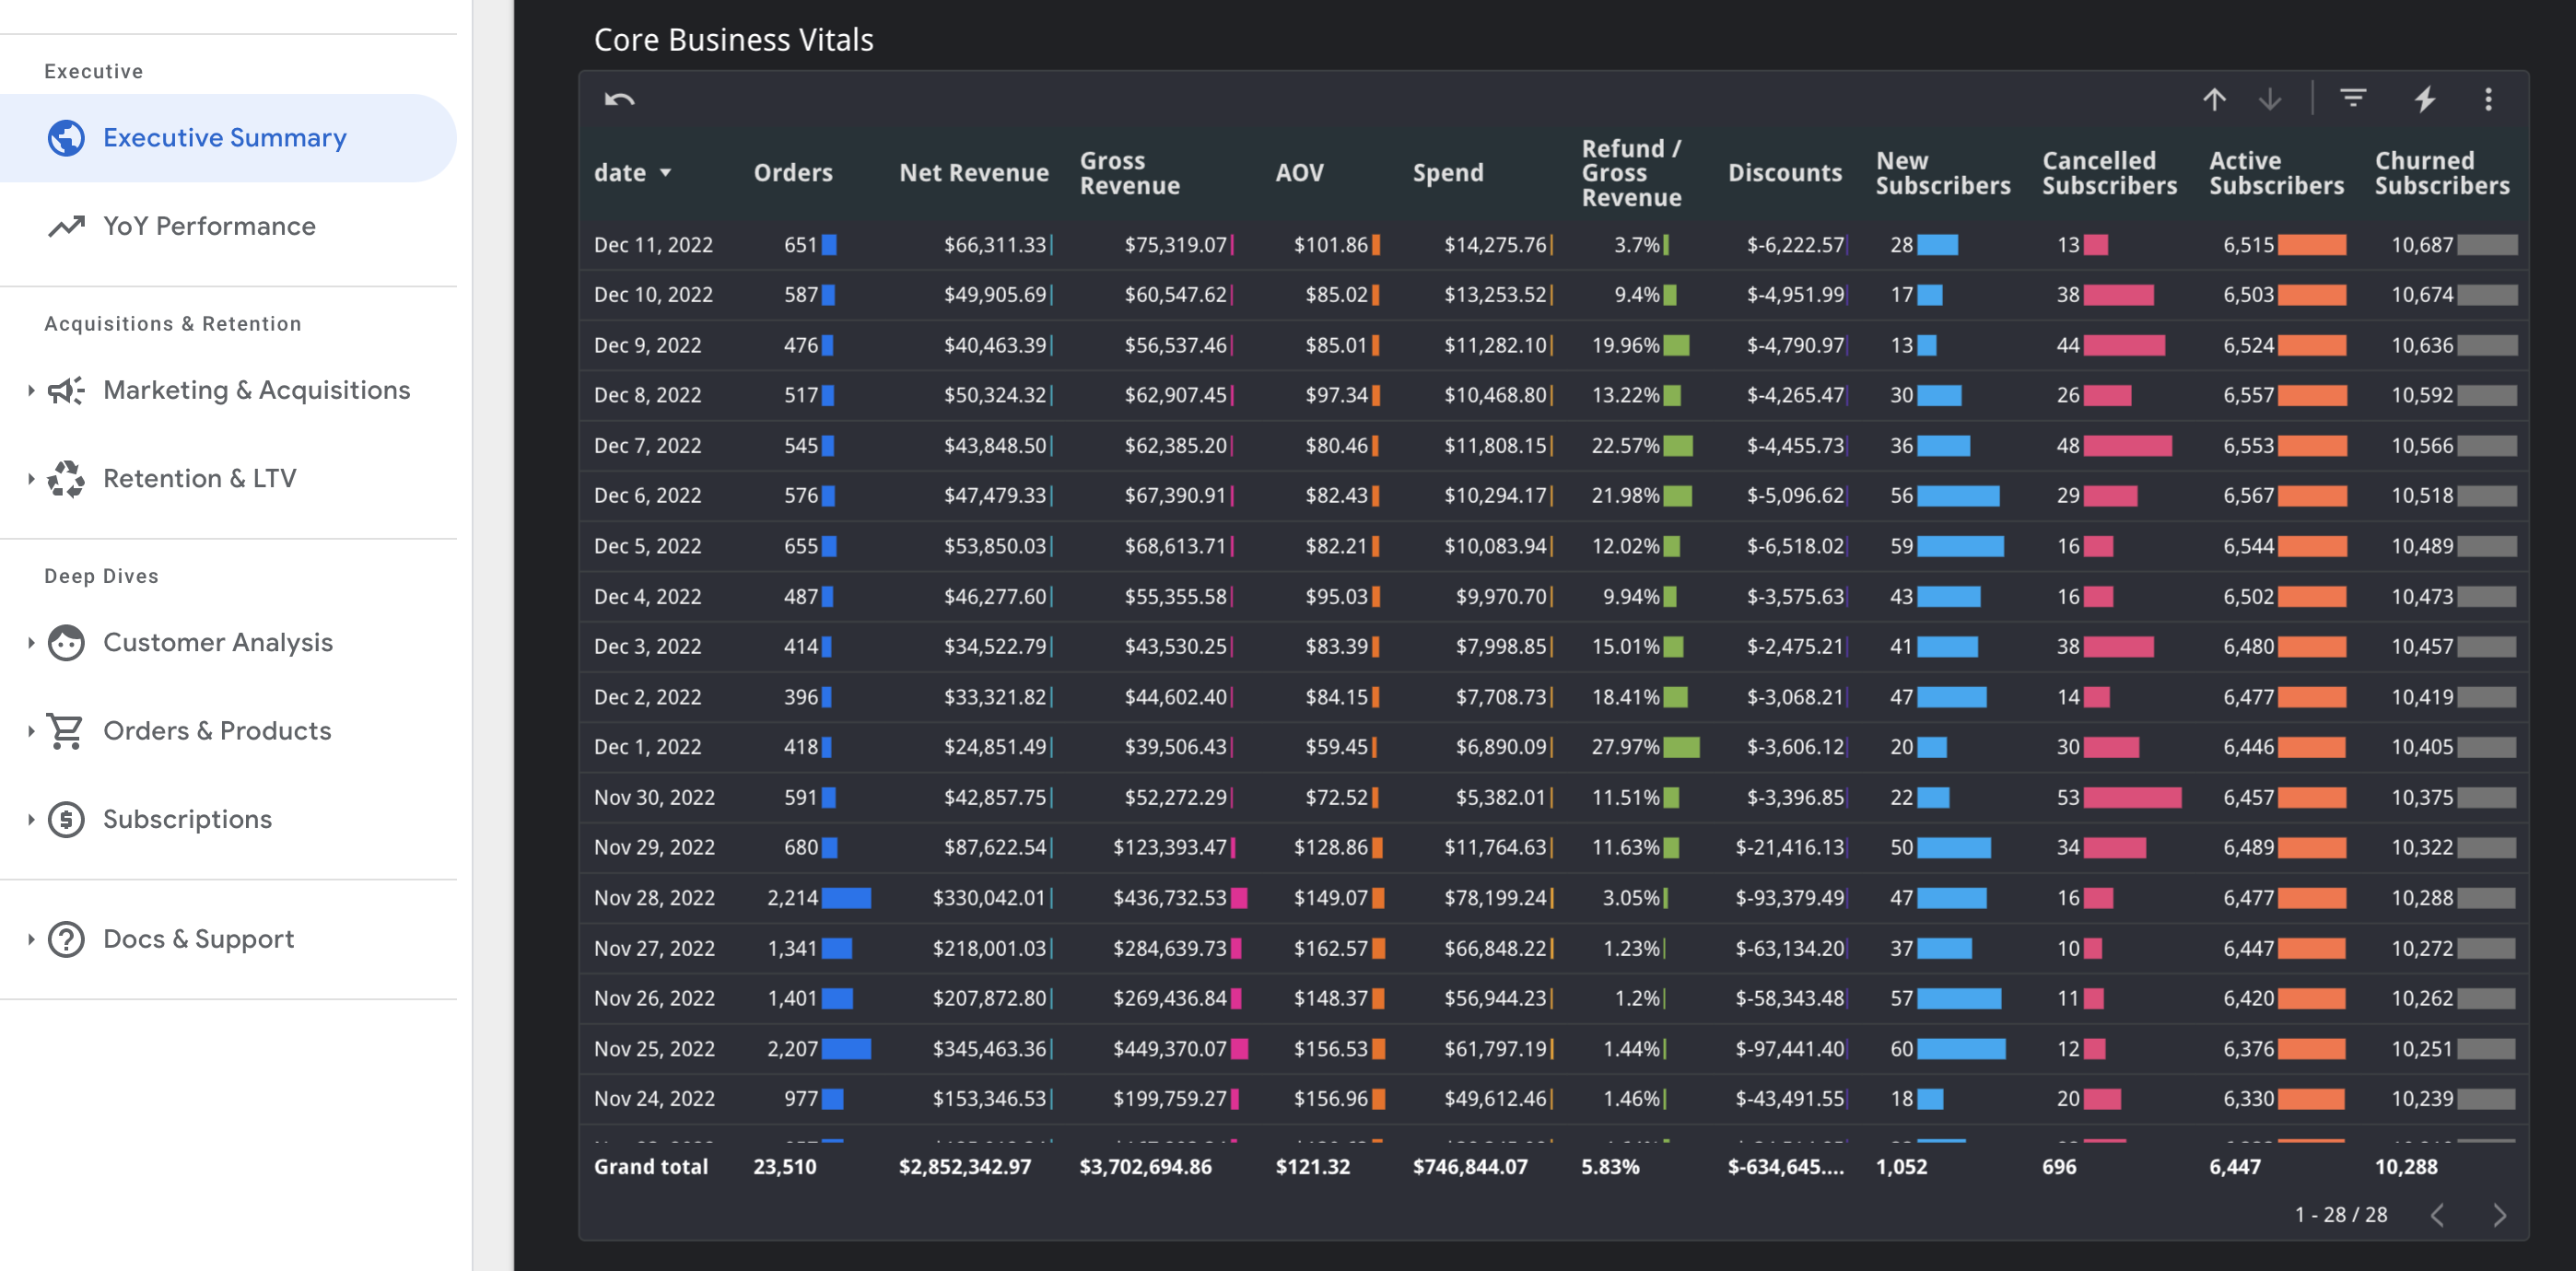
SourceMedium’s analytics dashboards have been carefully curated to surface the most important insights for your business. All users will have access to a range of modules that include:- Executive Summaries - a broad set of KPIs in one dashboard, ranging from revenue and order details to subscriber metrics (when applicable) and YoY tracking.
- Acquisition and Retention - various dashboards covering marketing performance on major ad channels (Meta, Google, Snap, TikTok, among others), email marketing, influencer tracking, and customer lifetime value and repurchase analyses.
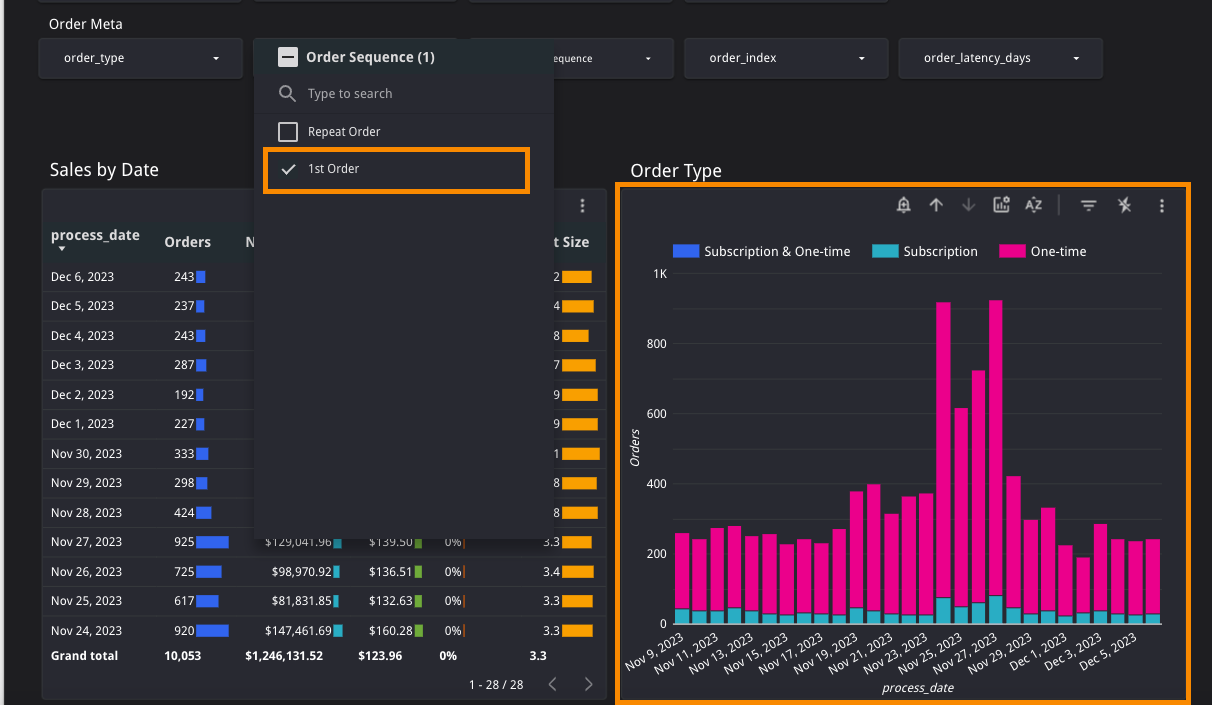
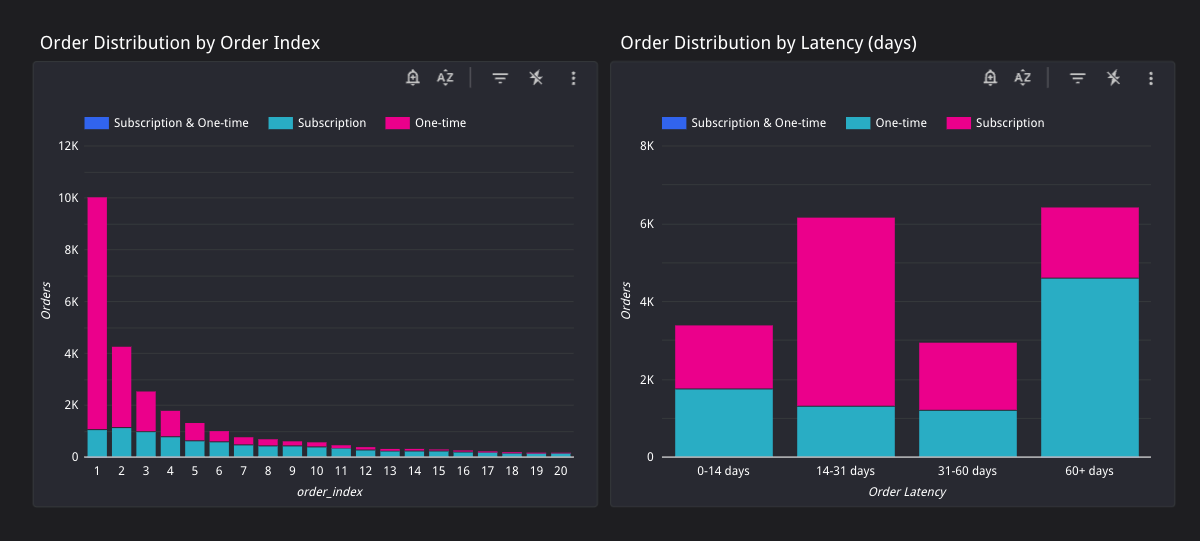
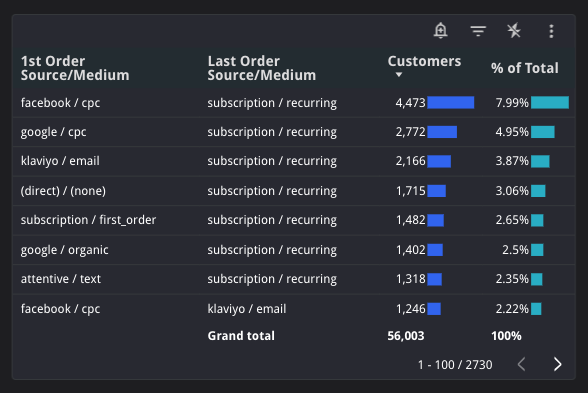
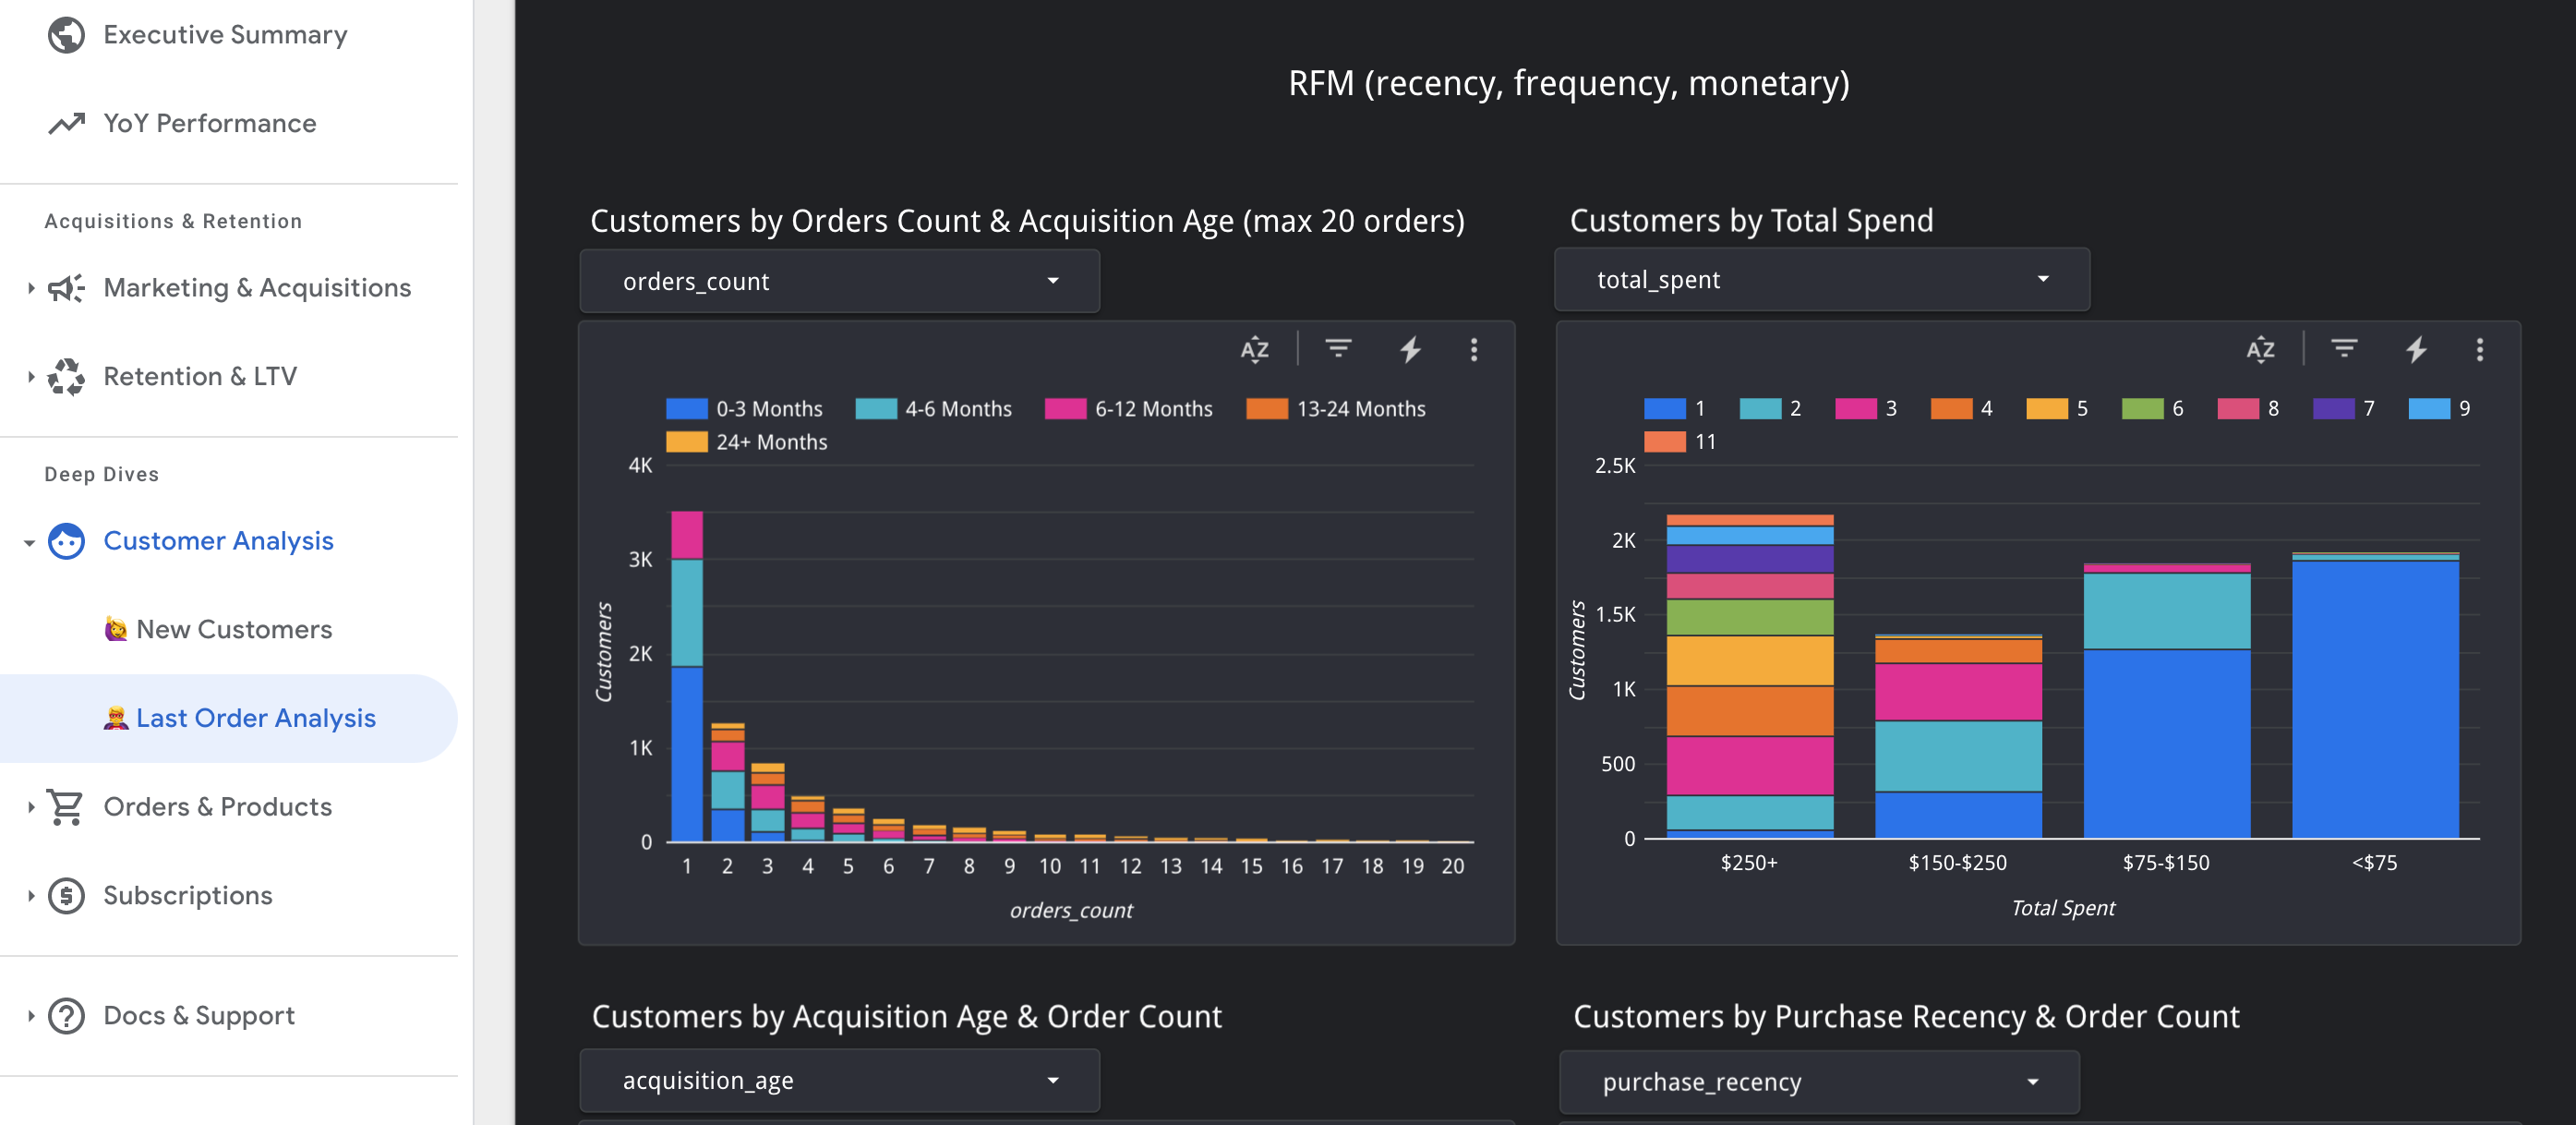
- Deep Dives - our most powerful dashboards provide your team deeper insights into customers’ first and last order behavior, order-level purchasing patterns and sales, and individual product performance.
3. Customizable Executive Dashboards
SourceMedium is similar to a set of lego blocks. Our Executive dashboards are flexible based on the needs of your business; we can rearrange, swap out, or create new metrics and visualizations using the proprietary SourceMedium data layer. Our Customer Solutions Analysts are dedicated to helping members of your team raise analytical questions and surface the right actionable metrics. Our constantly expanding Template Gallery provides inspirations for visualizations we have co-designed with our customers. Example 1: Setting monthly targets with SourceMedium scorecards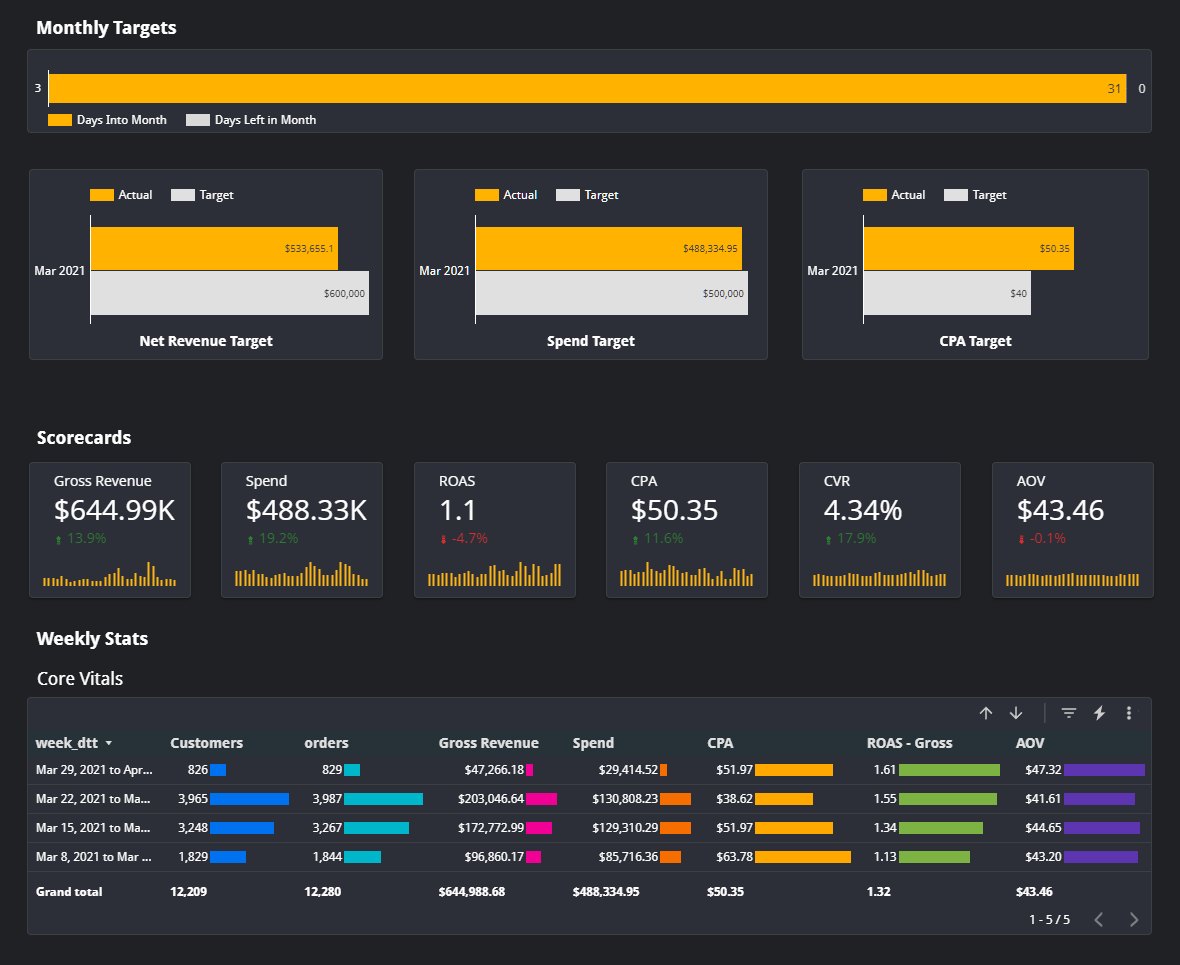
4. SourceMedium’s Key Features
While there are plenty of data visualization and reporting solutions out in the market, SourceMedium’s differentiation is in our customer first approach to asking and solving analytical questions. SourceMedium will:- Ensure that your data is clean and accurate in order to understand your true blended CAC and ROAS across your entire digital marketing efforts
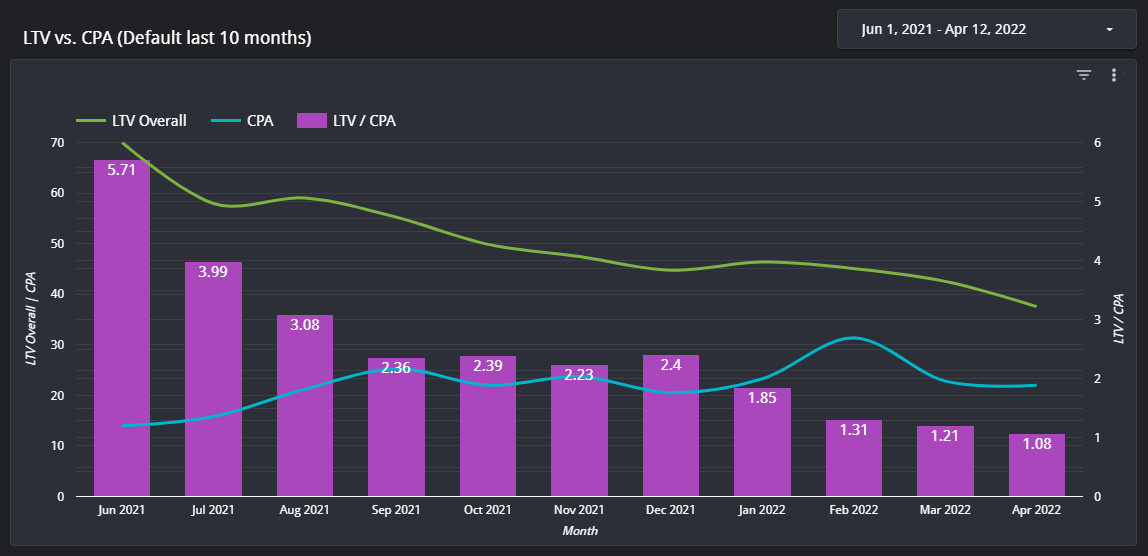
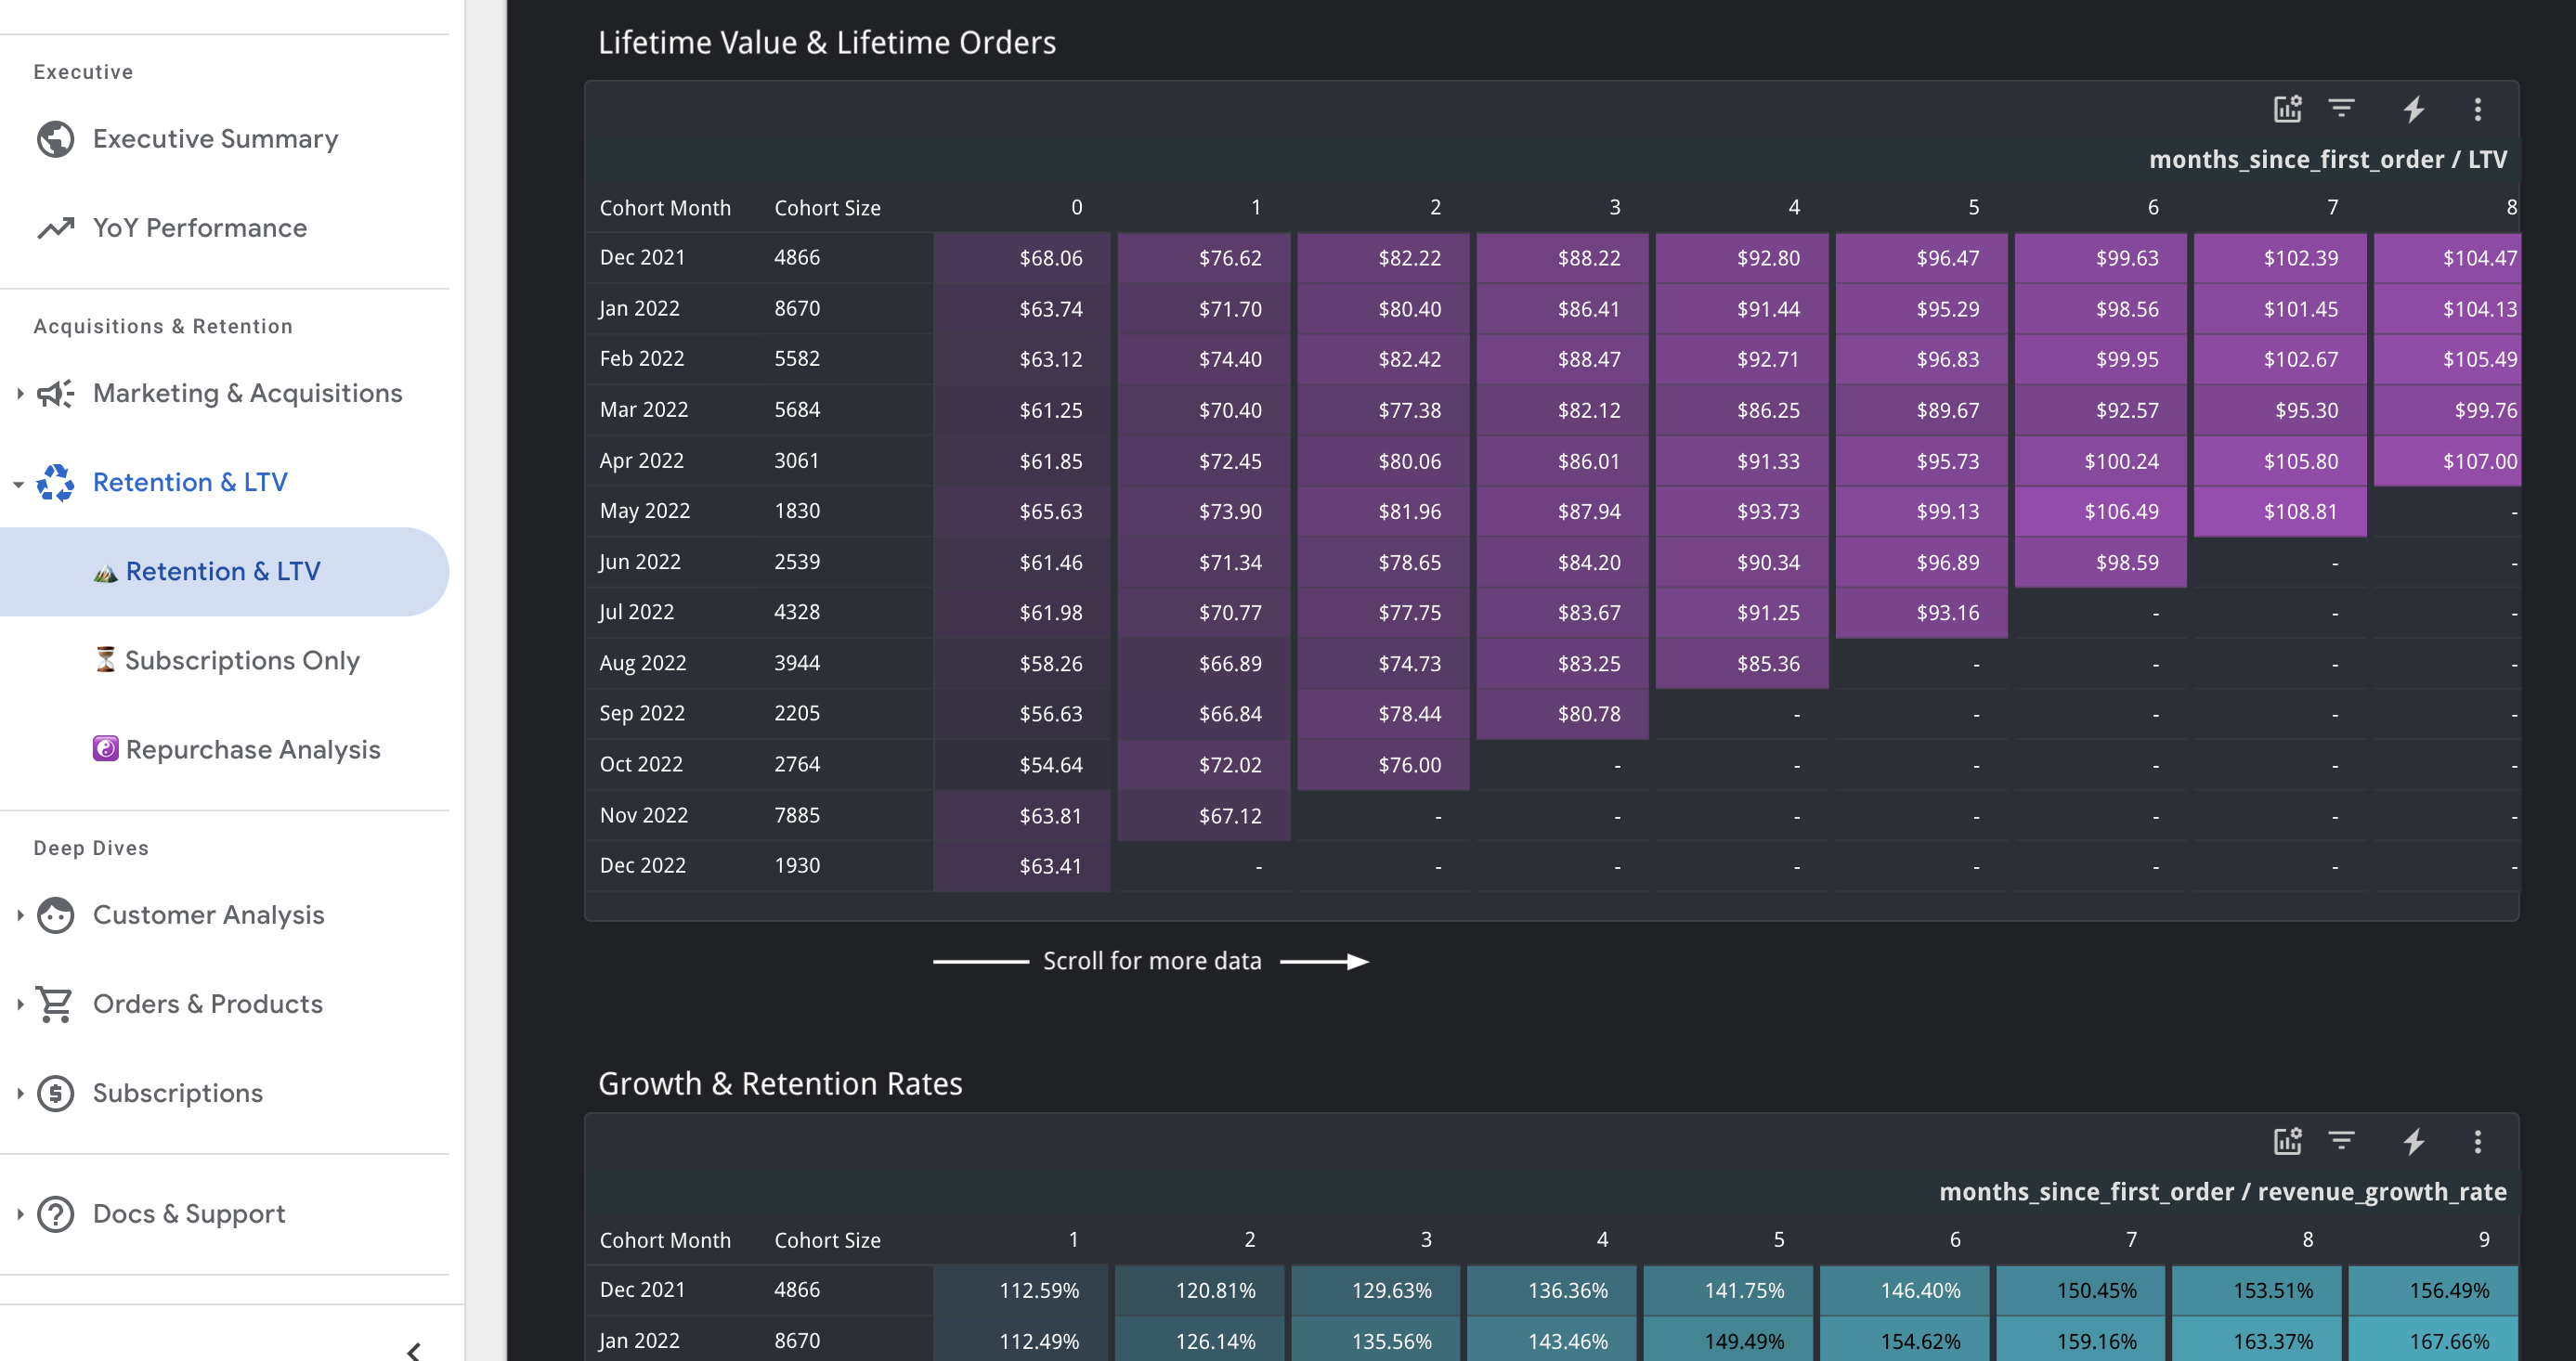
- Help to understand retention rates, lifetime value (LTV), and repurchasing behaviors of your most valuable customers
- Attribute orders using multiple UTM sources (Shopify visits, landing site, order notes, website events, GA4) and a clear selection hierarchy (see Attribution Source Hierarchy)
- Understand your product performance on a product or SKU level, as well as products most commonly purchased together.
- Get a clear understanding of your influencer performance and ROI with a custom influencer tracking solution
- Continue to grow our data connection footprint to meet your omni-channel needs with insightful and actionable data
- Receive customized reports emailed on a schedule that works for you
- Actionable daily Slack sales reporting on key business metrics
5. Asking Analytical Questions
The foundation of SourceMedium is to empower analytically minded teams that are willing to ask questions about business performance. We have witnessed that as teams begin to build the neural pathways to ask and answer certain questions, SourceMedium usage moves beyond the summary level statistics to advanced deep dives and customizations. Some of the early common analytical questions we’ve noticed include: Which marketing channels are driving repeat purchases?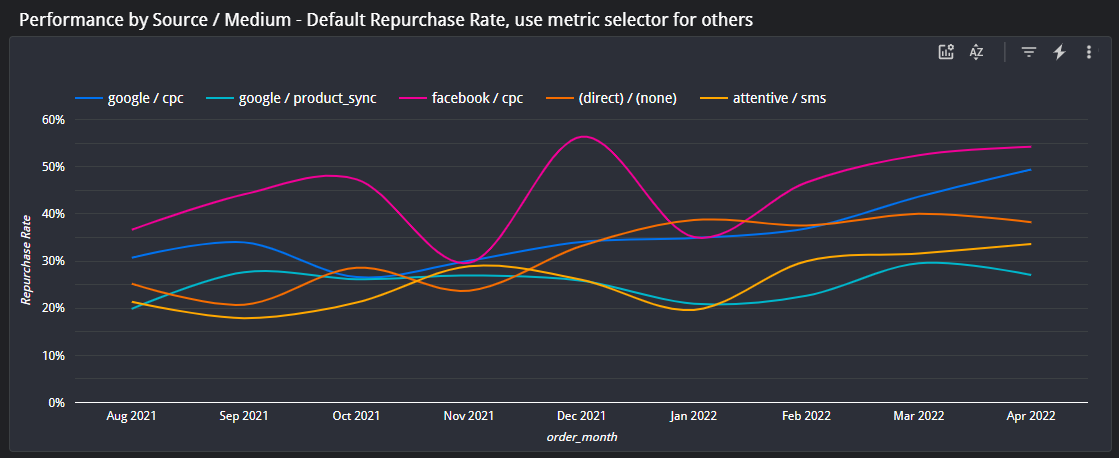
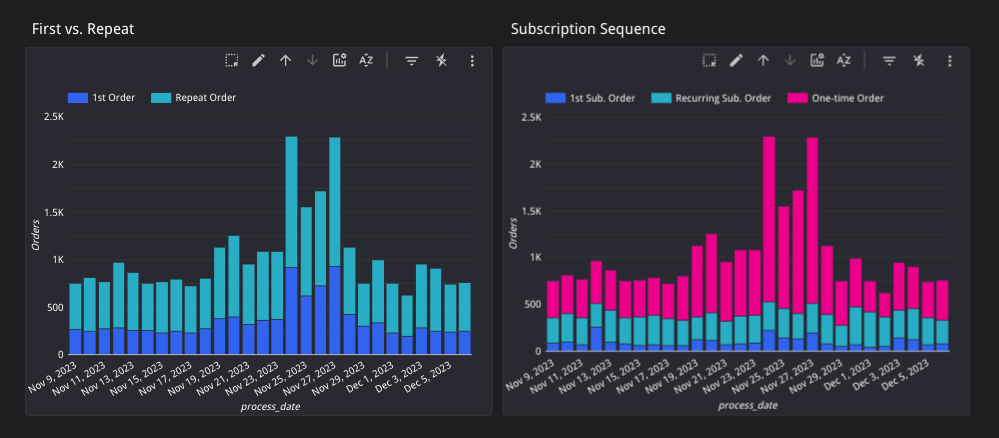
Repurchase Analysis deep dive includes a selection of charts that depict the story of repeat orders
What percentage of my orders are first time vs. repeat? What percentage of my subscription orders are first time vs. repeat?