The video below contains the same information as the guide, choose whatever format you prefer!
Confirm Your Data is Ready and Navigate to the Template Dashboard
Make sure you’ve gotten confirmation from a SourceMedium team member via Slack or email that your MTA data has been modeled and is present in your warehouse.Once you have confirmation your data is ready, navigate to the demo dashboard for the latest release of SourceMedium’s MTA reporting, which you can find at the link here. If you have any issues accessing the dashboard, reach out to a Source medium team member via Slack or email.
Copy the Template Dashboard and Add Your Data Sources
Once on the demo dashboard, use the 3 dots icon at the top right to bring up the menu and select Make a copy.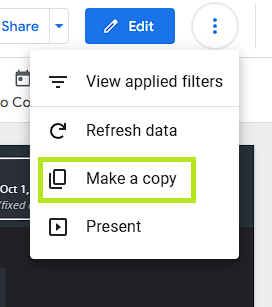
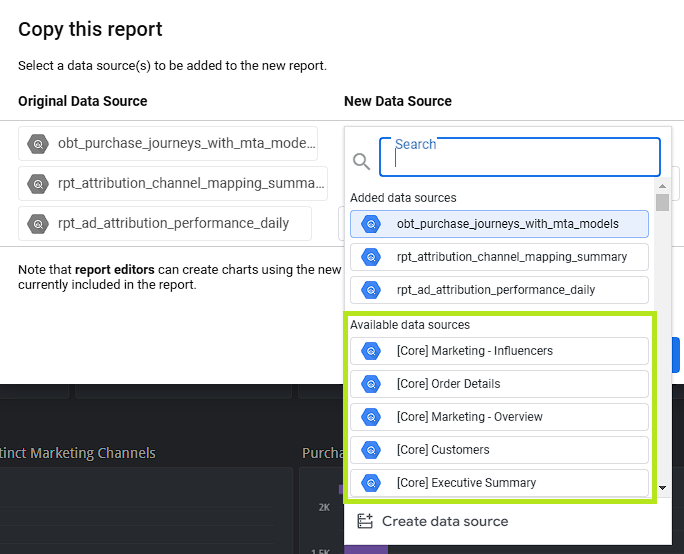
If you do not find matching data sources from your warehouse, you will need to create them using the Create data source button. Proceed to Step 3 for instructions on how to do so.
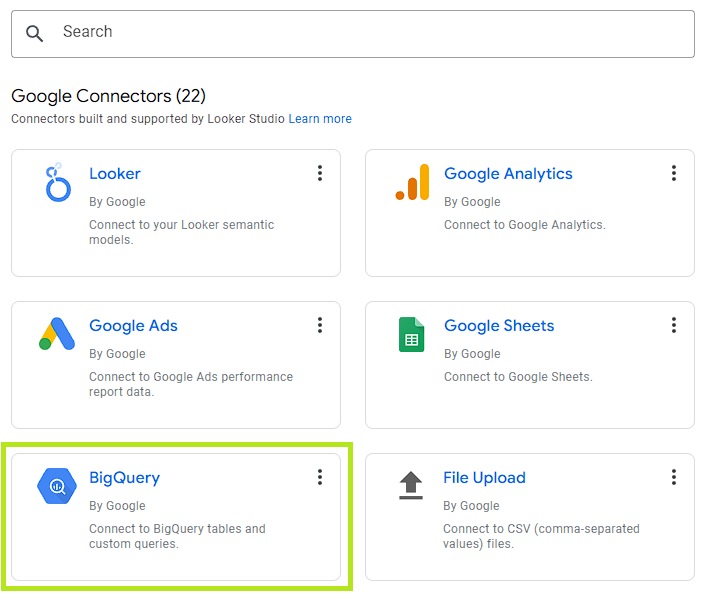
Create New Data Sources
If you do not find matching data sources from your warehouse, you will need to create them using the Create data source button.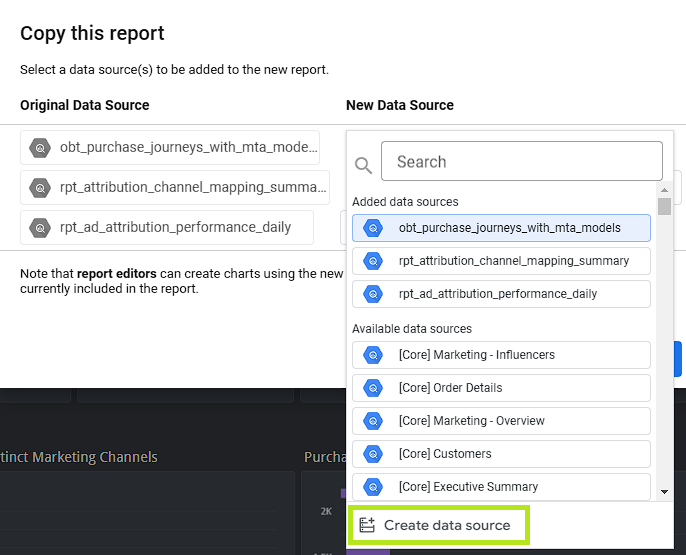
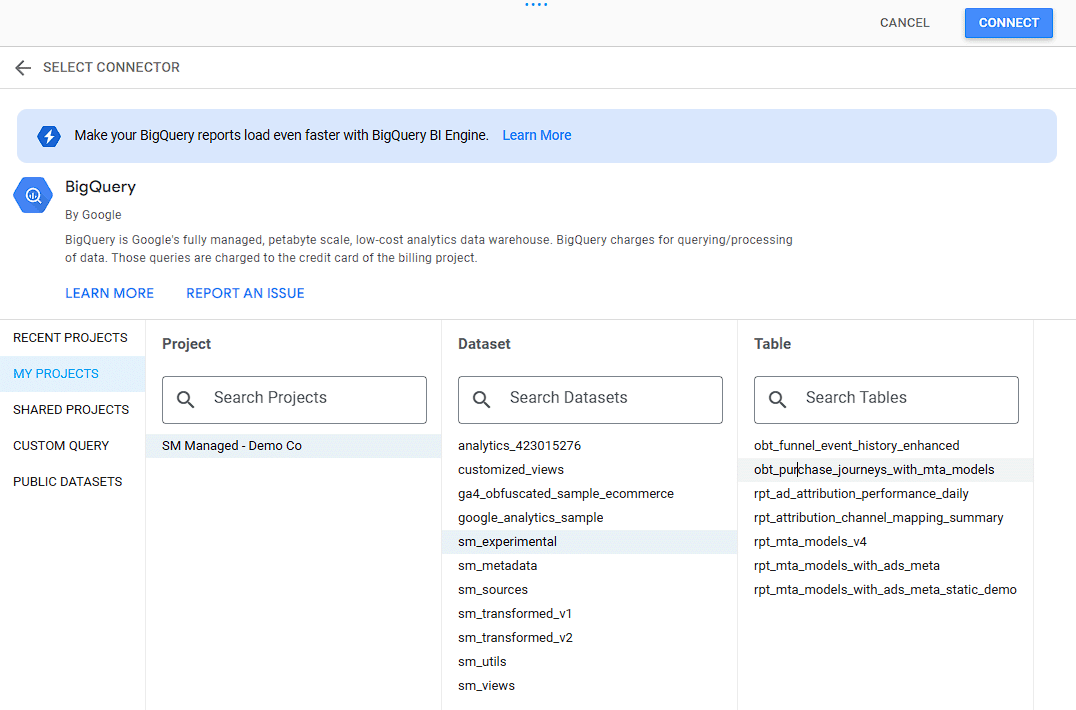
If you do not need to create data sources, proceed to Step 4.
- Project: SM Managed - Your Company Name
- Dataset: sm_experimental
- Table: obt_purchase_journeys_with_mta_models or rpt_ad_attribution_performance_daily
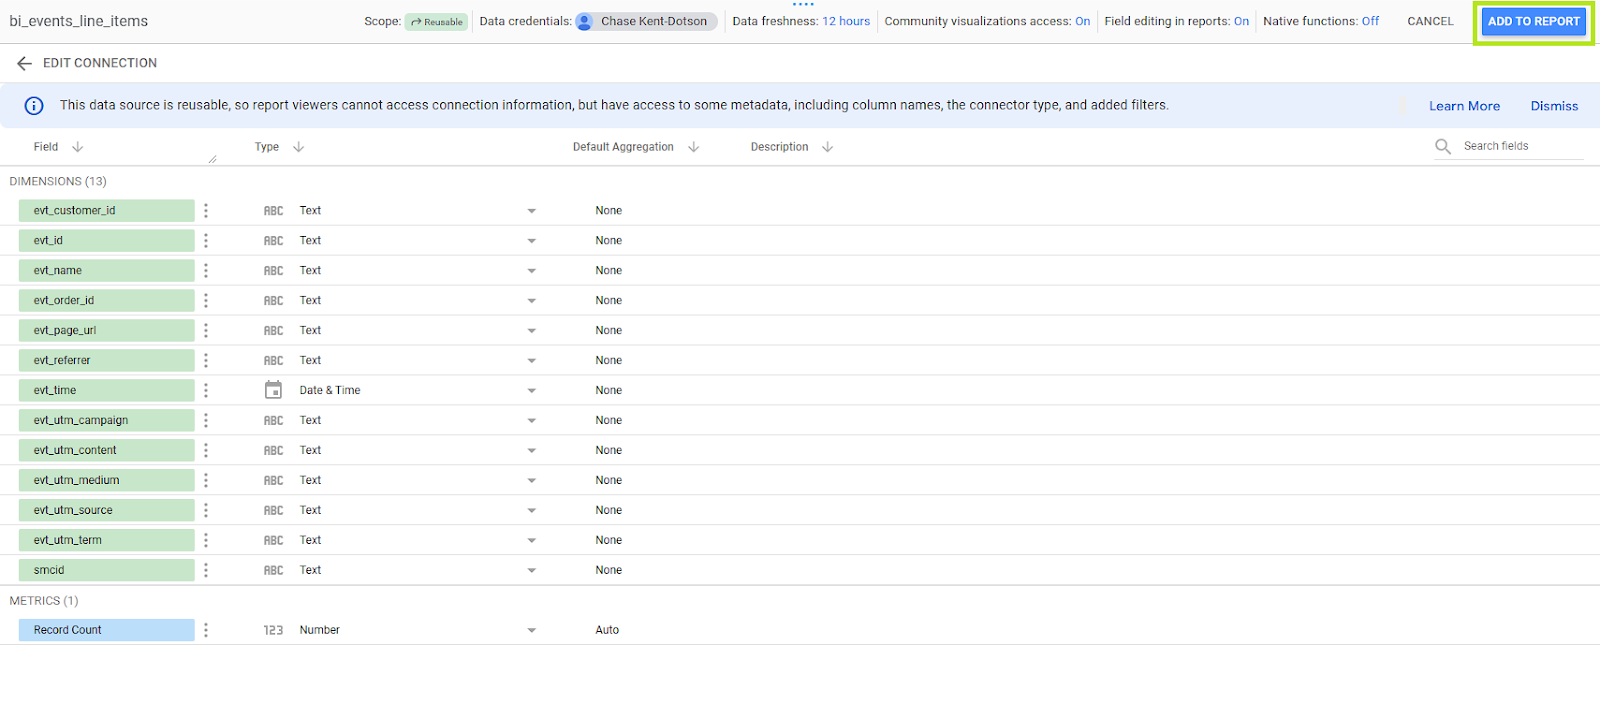
- After you’ve selected the correct Project, Dataset, and Table, click Connect and then Add to Report on the next screen to add the data source
Personalize Your Report
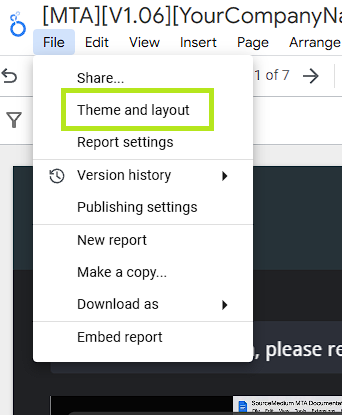
After selecting the correct data sources from your managed data warehouse, click Copy Report. You will automatically be brought into edit mode on your new MTA dashboard, which will need a few modifications.Start by changing the name of the report in the top left corner. Delete “Copy of” from the beginning of the name, and replace “Demo” with your company name.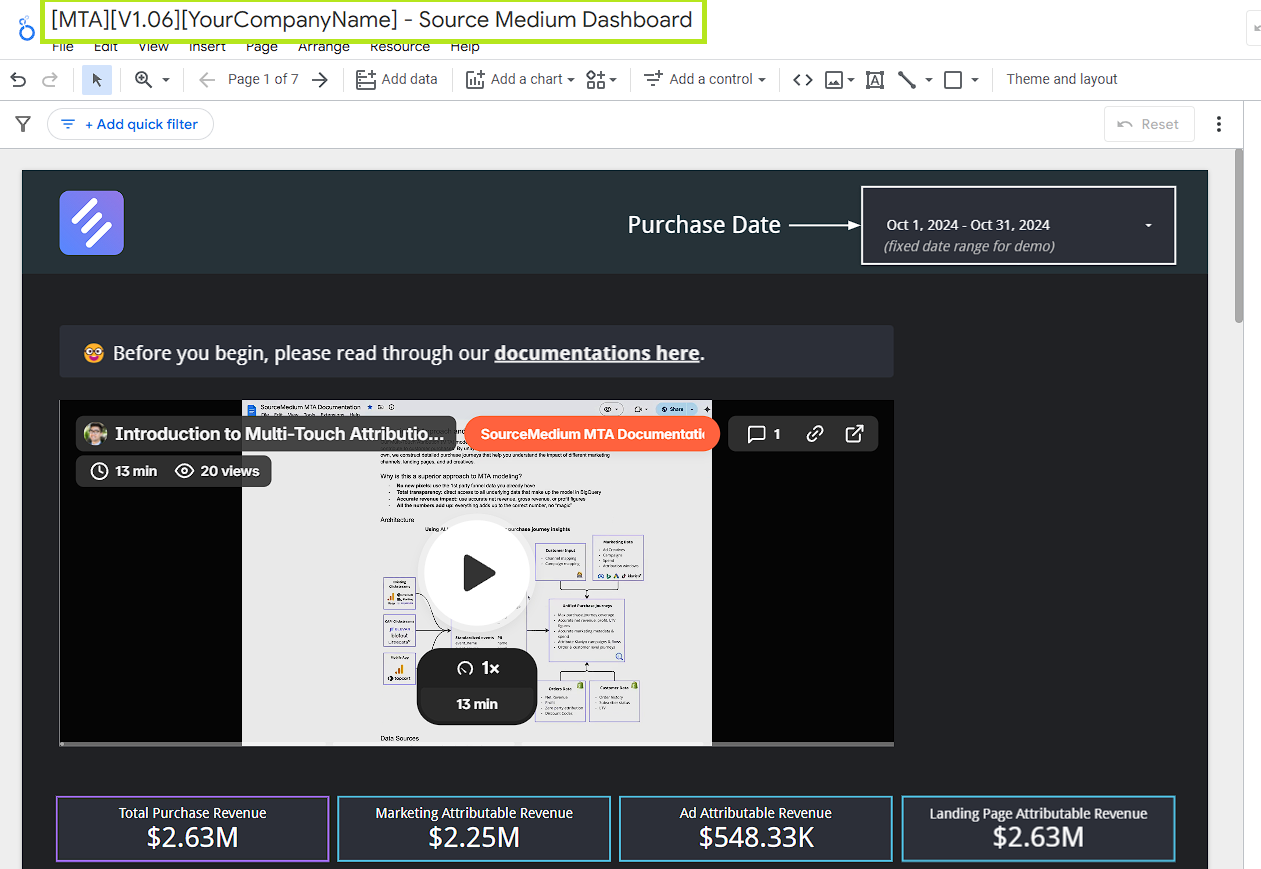
 If you wish to do so, you may replace the SourceMedium icon in the top left by clicking on it and then clicking the name of the default file in the Image Properties panel on the right. You will be prompted to select a new file from your computer. The icon is linked to all dashboard pages, so you only need to do this once.
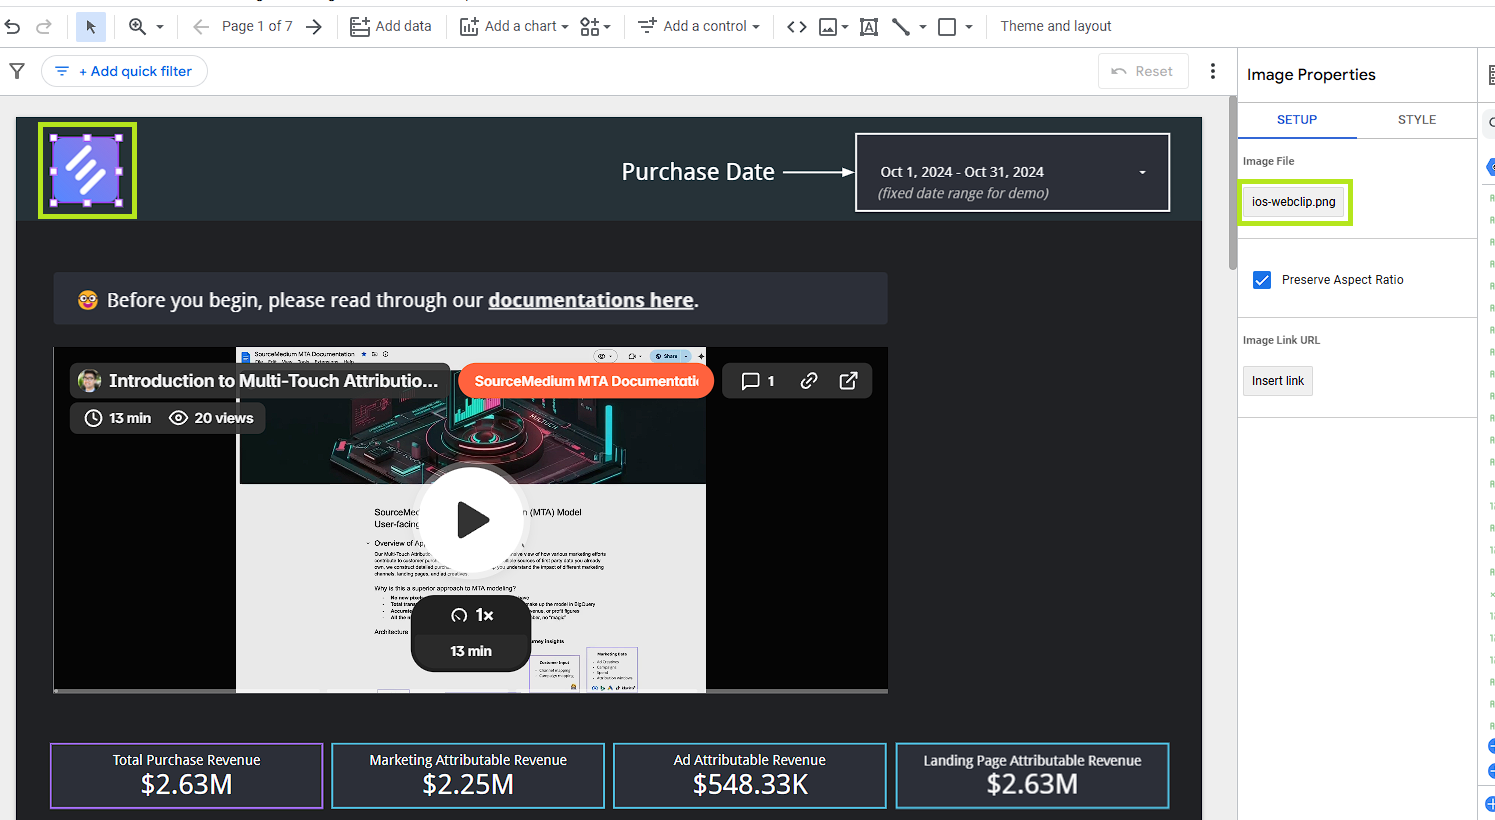
Delete the clear rectangle
Delete the text box
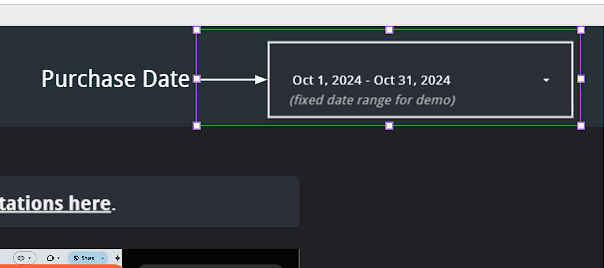
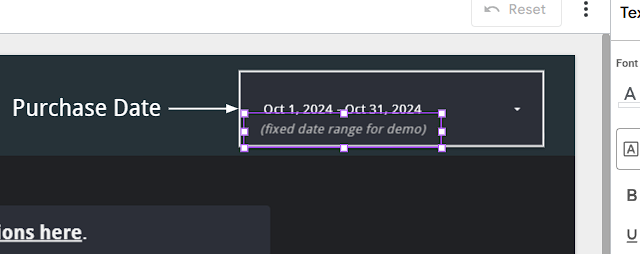
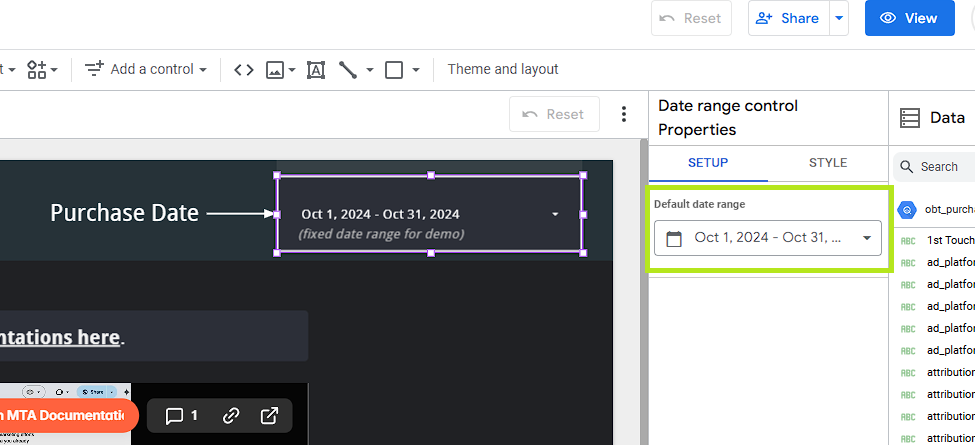
Change the default date range
Start Analyzing Multi-Touch Attribution Data!
You are now ready to use SourceMedium’s built-in multi-touch attribution reporting. Happy analyzing!
If you’d like to learn more about the basics of SourceMedium MTA, read our MTA Overview
For answers to common MTA questions check out our MTA FAQs or use the AI-enabled search bar above to quickly find what you’re looking for.